Last Updated on September 28, 2026 by Deon
Gold is facing selling pressure
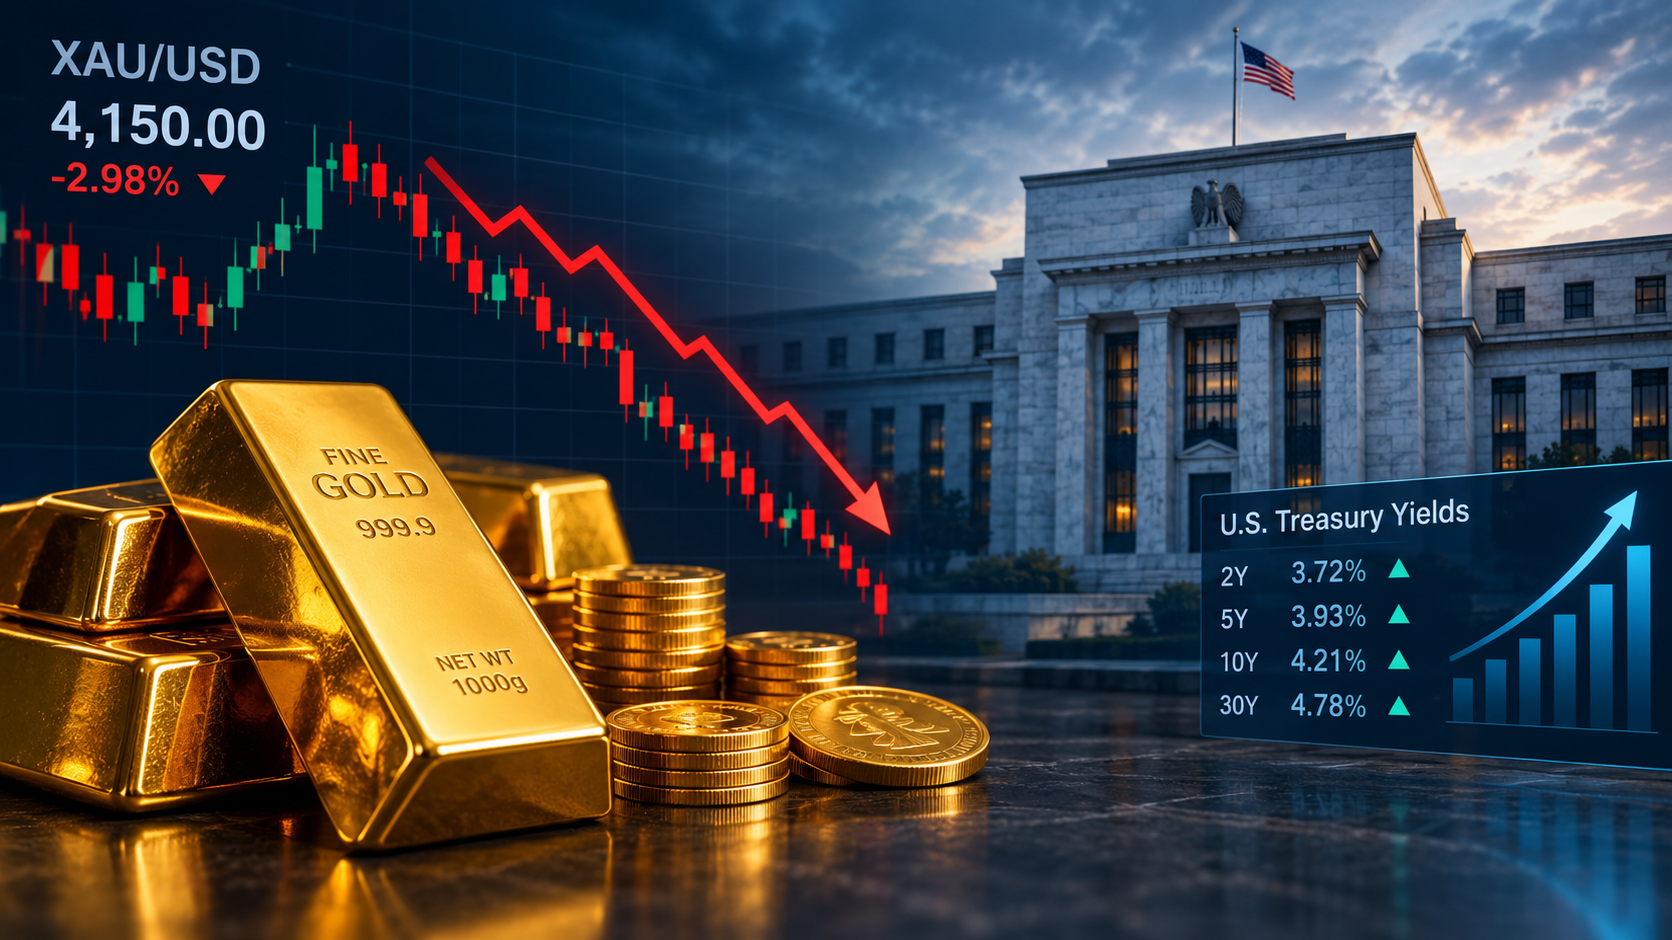
Gold prices started the new week sharply lower with XAU/USD falling nearly 3% to around four thousand one hundred fifty six dollars, its lowest level since August fifth. Rising expectations for another Federal Reserve interest-rate hike higher US Treasury yields and a stronger US Dollar have created selling pressure on the precious metal.
The decline comes despite continued uncertainty, which would normally provide support for gold as a safe-haven asset. However interest-rate expectations are currently playing a role in determining the direction of the market. Several factors are combining to pressure gold prices.
Rising Fed Rate-Hike Expectations
Markets are increasingly expecting another Federal Reserve rate increase. According to the FXStreet report traders were pricing around a seventy percent probability of an October rate hike based on CME FedWatch data.
The Federal Reserve had already raised rates by twenty five basis points at its September fifteenth to meeting. Recent hawkish comments from Fed officials have added to expectations that monetary policy could become more restrictive.
Higher interest rates generally create an environment for gold because the metal does not pay interest. As yields on interest-bearing assets increase the opportunity cost of holding gold also rises.
Treasury Yields Reach Multi-Year Highs
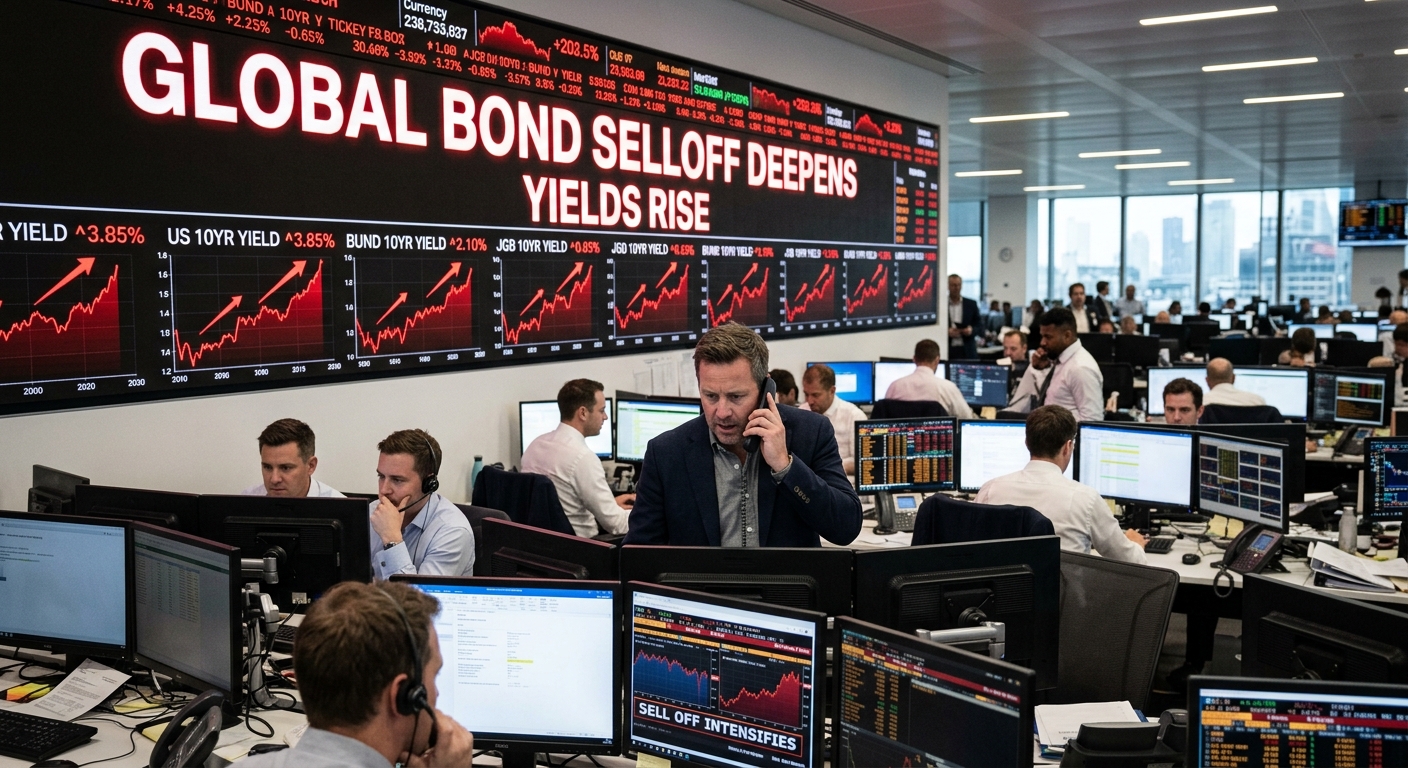
US Treasury yields have also become a driver of the gold selloff.
The ten-year US Treasury yield moved to around five point two three percent, its level since two thousand seven according to FXStreet. Higher yields can make bonds attractive relative to non-yielding assets such as gold.
This relationship is particularly important for traders watching XAU/USD because changes in Treasury yields can quickly influence precious-metal positioning.
Stronger US Dollar Adds Pressure
The US Dollar has remained firm as markets reassess the Federal Reserves interest-rate outlook. The US Dollar Index was trading one hundred one point one six when the FXStreet article was published.
Because gold is priced in US Dollars a stronger dollar can make gold more expensive for buyers using currencies and can contribute to weaker demand.
Oil Prices Add to Inflation Concerns
Higher oil prices are another factor behind the current move. Persistent disruptions involving energy supplies have increased concerns about inflation. Higher energy costs can keep inflation elevated. Potentially encourage the Federal Reserve to maintain a restrictive monetary-policy stance for longer.
This creates a combination for gold: rising inflation concerns are not necessarily supporting the metal because markets are simultaneously pricing in higher interest rates.
Geopolitical Risk Has Not Been Enough to Support Gold
Gold benefits from geopolitical uncertainty because investors often seek assets viewed as defensive.
However the current environment is different. The US-Iran situation has contributed to oil prices and supported the US Dollar while rising yields have increased the cost of holding gold.
As a result safe-haven demand has not been strong enough to offset the pressure created by interest-rate expectations and Treasury yields.
Gold Technical Analysis
From a perspective the short-term structure has turned increasingly bearish.
XAU/USD is trading below its fifty-day one hundred-day and two hundred-day moving averages indicating that sellers currently have control of the technical structure.
The Relative Strength Index (RSI) is thirty six moving toward oversold territory. Meanwhile the MACD remains below zero supporting the negative momentum.
Key Gold Resistance Levels
The first important resistance area is around four thousand two hundred ninety eight dollars corresponding to the one hundred-day SMA.
Above that traders may watch:
four thousand three hundred twenty dollars – fifty-day SMA
four thousand five hundred forty dollars – two hundred-day SMA
four thousand seven hundred dollars – horizontal resistance
A sustained move above these areas would indicate that selling pressure is beginning to ease.
Key Gold Support Levels
On the downside the first major support is around four thousand one hundred fifty dollars.
A break below this area could expose gold to the four thousand dollar level according to the technical levels highlighted by FXStreet.
US Economic Data Could Drive the Next Move Gold traders now face a busy economic calendar.
Important events include:
Event Why It Matters
US PCE inflation Provides clues about inflation pressure
ISM PMI Shows the health of US business activity
US Nonfarm Payrolls Important for Fed rate expectations
Fed speeches Can influence expectations for future policy
Treasury yields driver for non-yielding gold
The combination of inflation and employment data could influence expectations for the Feds next policy decision.
Gold Price Outlook
The short-term outlook for gold remains closely linked to US policy Treasury yields and the Dollar. Long as yields remain elevated and markets continue to price additional Fed tightening gold could remain under pressure.
However the RSI approaching oversold territory means traders should also watch for rebounds. A recovery above the moving- resistance levels would provide evidence that bearish momentum is weakening.
For now four thousand one hundred fifty dollars and four thousand dollars are downside areas while four thousand two hundred ninety eight dollars and four thousand three hundred twenty dollars are key resistance zones.
Key Takeaways
Gold fell three percent to around four thousand one hundred fifty six dollars.
Rising expectations, for another Fed rate hike are pressuring XAU/USD.
The ten-year US Treasury yield reached around five point two three percent.
A firm US Dollar is adding pressure.
Higher oil prices are increasing inflation concerns.
Gold remains below its fifty-day one hundred-day and two hundred-day moving averages.
Four thousand one hundred fifty dollars is a near-term support level, followed by four thousand dollars.
Traders will closely watch US inflation PMI and employment data this week.