
Last Updated on June 4, 2025 by Deon
Here’s today’s outlook for gold (XAU/USD):
📈 Technical Overview & Key Levels
This analysis will help you to take profitable long and short trades. If you plan a scalp set up then do consult this analysis.
- Neutral–Bullish Short-Term:
- Investing.com indicates neutral to mixed signals: MAs are mostly “Buy,” but technical indicators lean “Sell” or “Neutral” (investing.com, centralcharts.com).
- Support & Resistance Zones:
- Support range sits around $3,330–3,355 (forex24.pro, centralcharts.com).
- Resistance lies near $3,365–$3,400, with a key pivot at $3,377 (fxstreet.com).
- Trade Signals:
- DailyForex suggests a sell at ~$3,440 (targeting $3,280) and a buy from the ~$3,310–$3,320 support band (targeting $3,470) (dailyforex.com).
- Forex24 foresees a short dip toward ~$3,320–$3,330 before resuming an uptrend to around $3,485 (economies.com).
🌐 Market Drivers
Fundamental analysis is also important if you are a professional trader. This will help you to keep holding your trades for days or it will help you to open big trades as well.
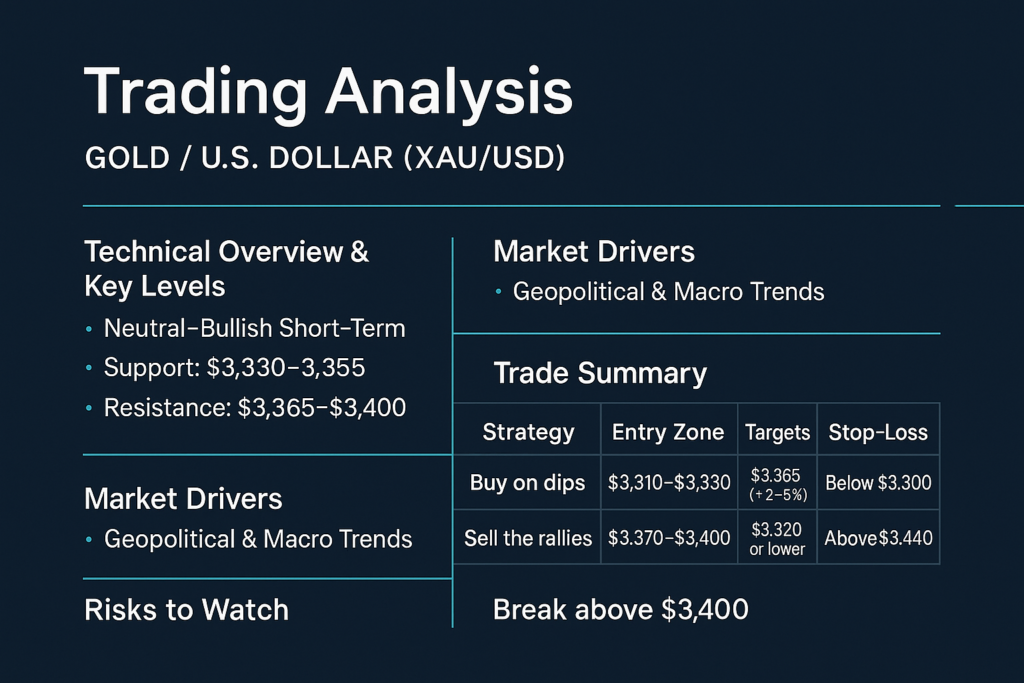
- Geopolitical & Macro Trends:
- Ongoing trade tensions, tariffs, and global risk continue to buoy gold as a safe-haven asset (fxstreet.com).
- Forecasts & Analyst Insights:
- Economies.com notes a bullish momentum with RSI above 50 and 20‑EMA support (coincodex.com, economies.com).
- FXStreet expects gold to retest resistance near $3,377–$3,400 ahead of this week’s U.S. economic data (fxstreet.com).
✅ Trade Summary
| Strategy | Entry Zone | Targets | Stop‑Loss |
|---|---|---|---|
| Buy on dips (recommended) | $3,310–$3,330 | $3,365–$3,400 (+2–3%) | Below $3,300 |
| Sell the rallies | $3,370–$3,400 | $3,320 or lower | Above $3,440 |
You can consider buying near $3,315, aiming for around $3,380, with a tight stop under $3,300. Alternatively, selling from $3,370–$3,400 could work if you’re aiming to play a short-term pullback.
⚠️ Risks to Watch
- A break above $3,400 could push gold toward $3,440–$3,485, invalidating sell setups (forex24.pro, economies.com, fxstreet.com, investing.com, dailypriceaction.com, centralcharts.com).
- A drop below $3,330 may indicate deeper downside to $3,280 .
- U.S. data (JOLTS, ISM PMI) and trade headlines (tariffs, China talks) remain key catalysts (fxstreet.com).
🏁 Verdict: Buy the Dip, Watch Resistance
Short-term trend favors buying on dips near support with tight stops. However, if $3,377–$3,400 is reached, a sell approach could be appropriate if technical resistance holds.
Hope that helps! Want charts, entry/exit alerts, or updates as U.S. data drops?