Last Updated on June 29, 2024 by Deon
The descending channel pattern is created by drawing a trendline connecting the lowest points of the troughs and then extending that line to where it intersects with an upward-sloping trendline that connects two or more peaks. Each trough gets lower than the previous trough, which can be either two, three or four troughs. This pattern is a reversal of the ascending channel. A down-trending price tends to be met with lower lows and lower highs, resulting in a downward-sloping trend line called the “descending resistance line.” The same relationship works in reverse for an up-trending price.
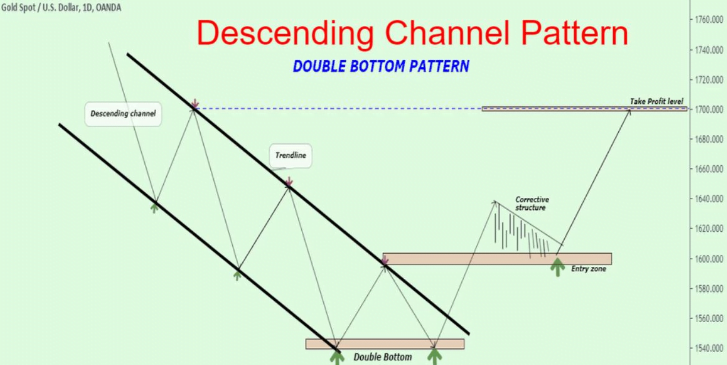
Descending channel pattern is a short-term bearish continuation pattern that forms after a spike in price. The descending channel starts with an upward trend followed by a downward trend that has two nearly parallel channel lines. The bottom of the channel usually serves as support and top line is deemed as resistance. After bearish channel gets completed you may expect upward move after confirmation.
How to trade the descending channel pattern?
The descending channel pattern is a very common trading strategy that can be used to predict a downward price movement. The pattern involves two downtrends lines, which are separated by an area of consolidation. In other words, it looks like a ladder with alternating steps up and down.
- The first step in trading the descending channel pattern is to identify the upper trend line. This will be a bearish line drawn at the highest price point during one of the downtrends.
- The second step is to identify the lower trend line. This will be a line drawn at the lowest price point during one of the downtrends.
- Once you’ve identified these two lines, you’ll need to estimate where they intersect with each other on your chart.
- You should draw an imaginary line between them so that it makes no difference which way they’re drawn—this is just for visual purposes only!
- Once you’ve drawn these lines on your chart, look for potential support or resistance zones below or above them
There may also be some overlap between each zone depending on how far apart they are from each other (for example, if both lines are horizontal then there may not be any overlap). It’s important to note that this doesn’t mean you won’t profit from trading either zone at all. The descending channel pattern is a great way to evaluate stocks/currency pairs.
Descending channel pattern structure
The descending channel pattern structure is a pattern used in trading. It is also known as the “bouncing bottom”. The name comes from the way it resembles a descending channel.
New Low is Lower than Previous Low
The pattern consists of a series of higher lows and lower highs, with each new low being lower than the previous one. The price action in this pattern can be either bullish or bearish.
The descending channel pattern structure is used to describe the relationship between two or more price points. In this case, the price point on the left represents the lower price point and the price point on the right represents the higher price point. The pattern starts with a high volume of trading activity at the top of a channel and then decreases in volume as it moves down and then back up again to a high volume of trading activity at its bottom.
Can Indicators help in the Bearish channel pattern?
If you’re in a downtrend and are seeing a descending channel pattern structure, it’s time to start looking for sell-trade opportunities. Sometimes you may need to do is look at the indicator that you’re using to watch your trades. No indicator is best but yes they can help you to identify the best trading options. The trendline is one way to see if the market is still moving in the direction, you want it to, but it doesn’t always show the whole picture. You may be able to get a clearer view by looking at other indicators such as
- RSI (Relative Strength Index)
- MACD (Moving Average Convergence Divergence)
- CCI (Commodity Channel Index)
While these indicators can give you more information about where the market is heading, they also take more time to evaluate and react than just checking how far away prices are from their moving averages or where they are on their trendlines. You can use the descending channel pattern to provide a path for the user to follow when they are transitioning between different channels and to create a clear visual hierarchy.
For More Information on forex education check out, Neuron Markets