Last Updated on June 21, 2026 by Deon
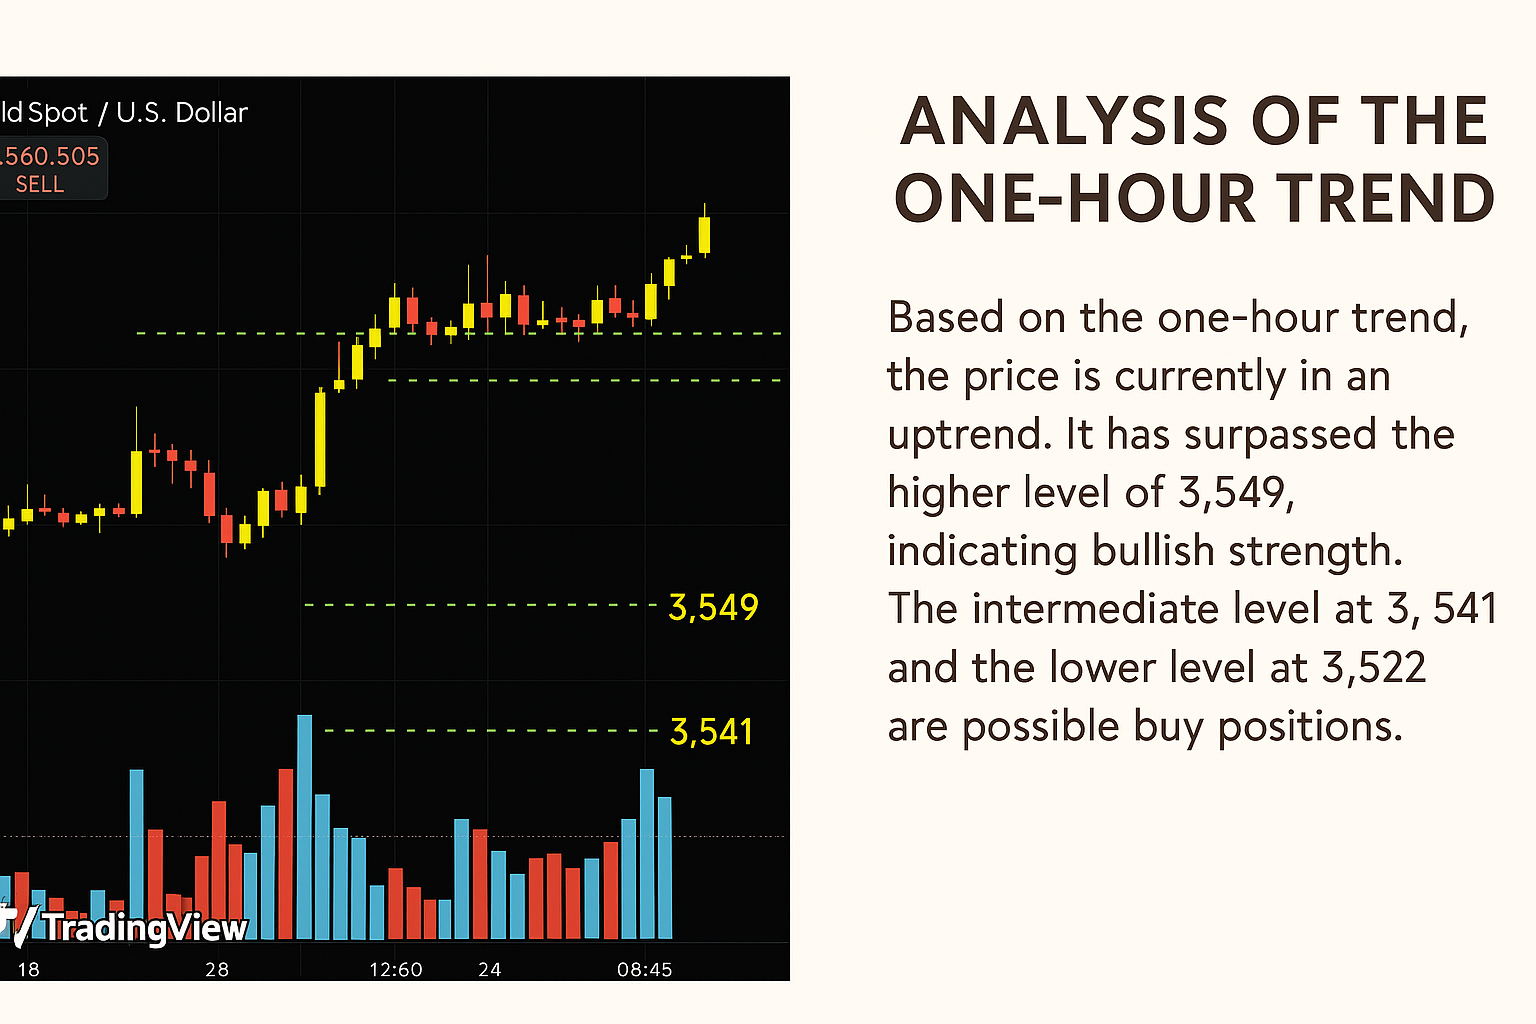
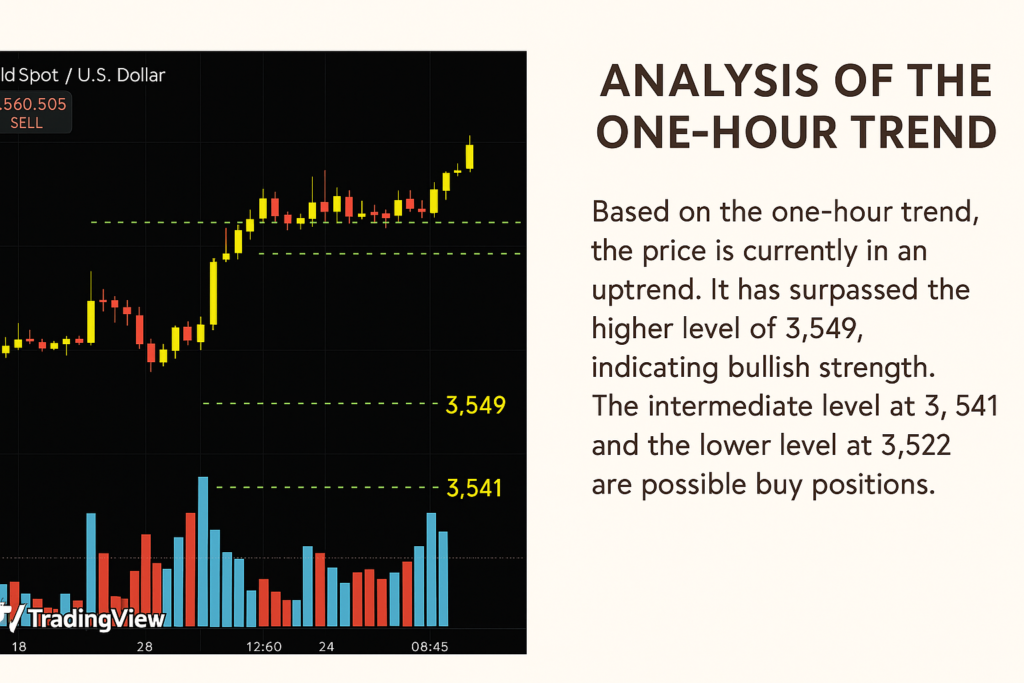
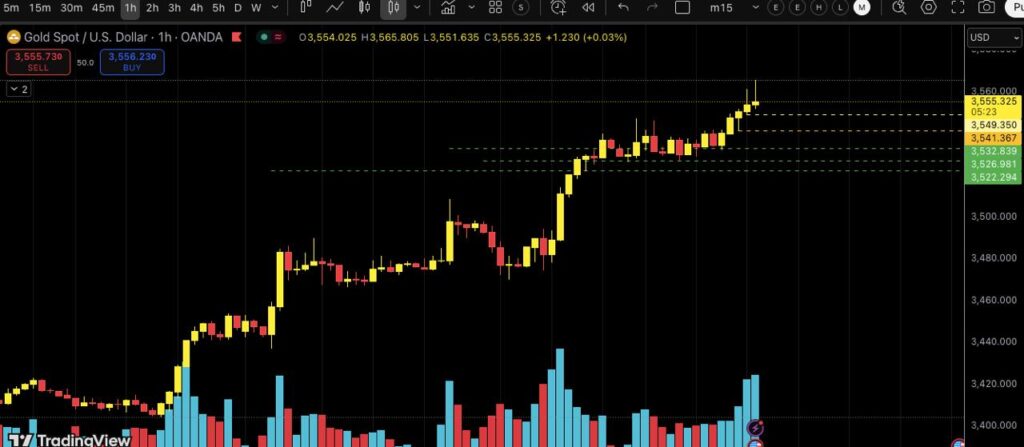
If you examine the chart, a clear bullish trend is evident. Gold (XAUUSD) remains in a bullish trend on the 1-hour chart, with buyers in firm control of recent trends. After some consolidation, it broke higher to reach around $3,560 as a short-term resistance level. You can note down these levels in your trading journal.
Market Structure is also bullish:
It means Gold is giving respect to its structural levels in a bullish rally. Observing the Trend Candlesticks reveal an upward progression of higher highs and higher lows, which is a telltale sign of bullish pressure. Breakout from the consolidation zone signifies renewed buyer optimism, while volume surges during upward moves demonstrate that traders are actively supporting this rally.
An initial breakout on a 1-hour timeframe often signals further momentum, provided the price holds above immediate support levels.
Take a closer look at the levels I have highlighted:
Resistance/Current Price Area):
Obviously, now there is no news ahead for several hours so these levels will remain valid if no hidden fundamental play its role. This level is currently serving as resistance, and any significant movement above it would signal fresh upward momentum. A successful close could open the way towards increased upside momentum.
$3,549.3 (Near-Term Support):
This level serves as the first line of defense for buyers; so long as prices stay above this point, the bullish trend remains intact. A sharp scalp entry is expected. You can practice these levels on your demo account as well if you want a full understanding, as they are for educational purposes only.
$3,541.3 (Key Support):
A strong support level that coincides with previous price action. Should prices decrease, buyers may attempt to reenter at this level. That’s the 2nd support level.
$3,532.8-3,522.2 (Buy Zones/Demand Area):
These levels represent a cluster of supports and potential buying zones. They represent accumulation areas where previous pullbacks met demand from buyers; revisiting this zone may bring new buyers for an uptrend push. It means after hitting stop losses, the market may get a bounce, which can earn profit for you.
What should be the approach for short-term scalpers?
Short-term traders should focus on whether gold can sustain above $3,549-$3,541. If these levels hold, momentum would favor an upswing, and more extensions could occur beyond $3,560 towards higher targets. Conversely, any breach below $3,532 could signal a deeper pullback and diminish any bullish outlooks.
Long-term or low-risk support levels:
Swing traders might wait for a retest of the lower support cluster ($3,532-$3,522) before considering buy entries, as this zone has shown to provide reliable demand.
Conclusion
So, now its very clear that overall, the 1-hour chart paints an optimistic picture for gold as long as price stays above the $3,541-$3,532 support zone. Resistance lies at $3,560; any breakout here could signal further upside. Buying activity remains strong, and any dips toward any highlighted buy zones will likely be closely watched by traders looking to ride out this trend.
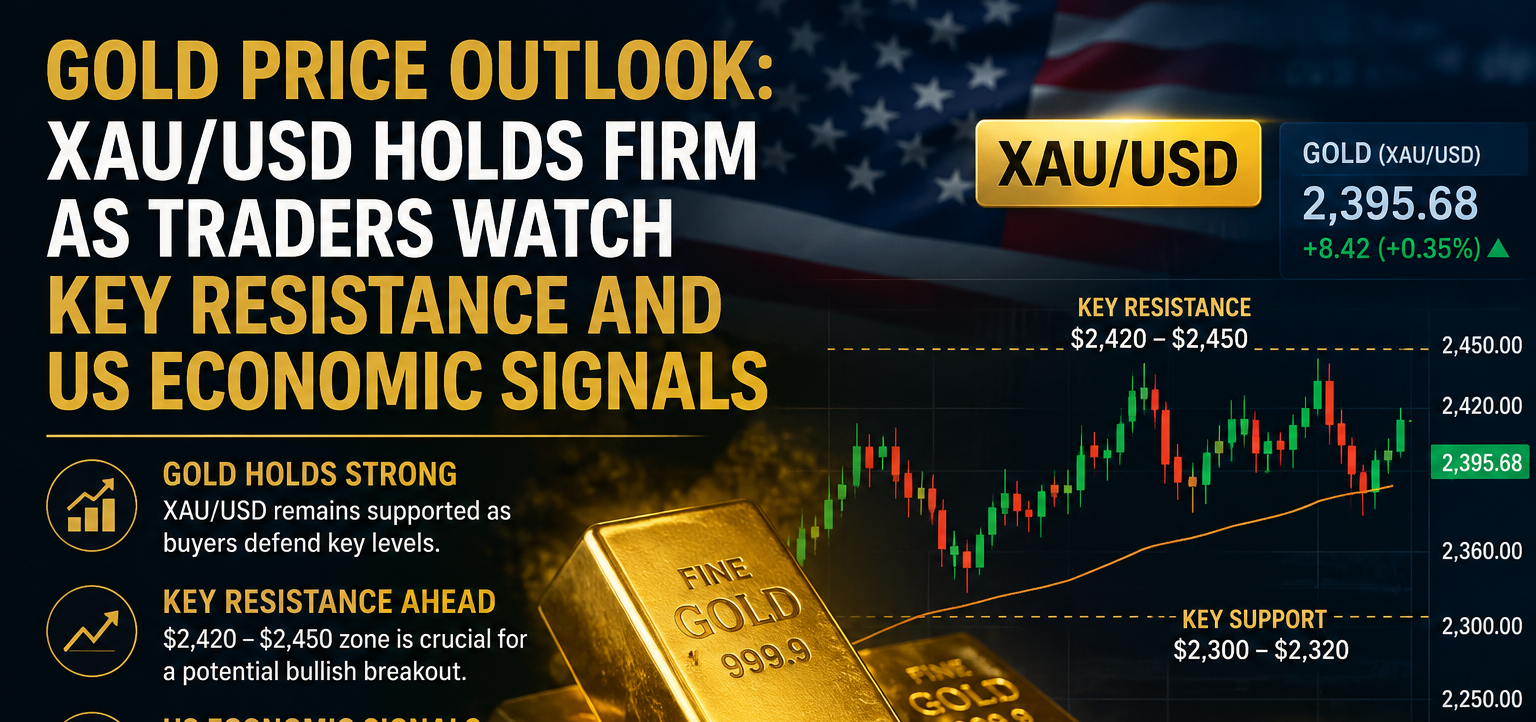
Gold (XAU/USD) remains a major focus for traders as price action on the 1-hour chart continues to reflect shifting market sentiment and expectations surrounding global economic developments. The precious metal has been trading within a defined range, with buyers and sellers battling for control near key technical levels. Traders are closely monitoring support zones, as a break below these areas could trigger additional downside pressure and encourage short-term bearish momentum.
On the upside, resistance levels remain crucial for determining whether gold can resume its broader bullish trend. A sustained move above immediate resistance may attract fresh buying interest and open the door for a stronger rally. Technical indicators on the 1-hour timeframe, including moving averages and momentum oscillators, suggest that volatility could increase as the market reacts to economic data releases and changes in US Dollar strength.
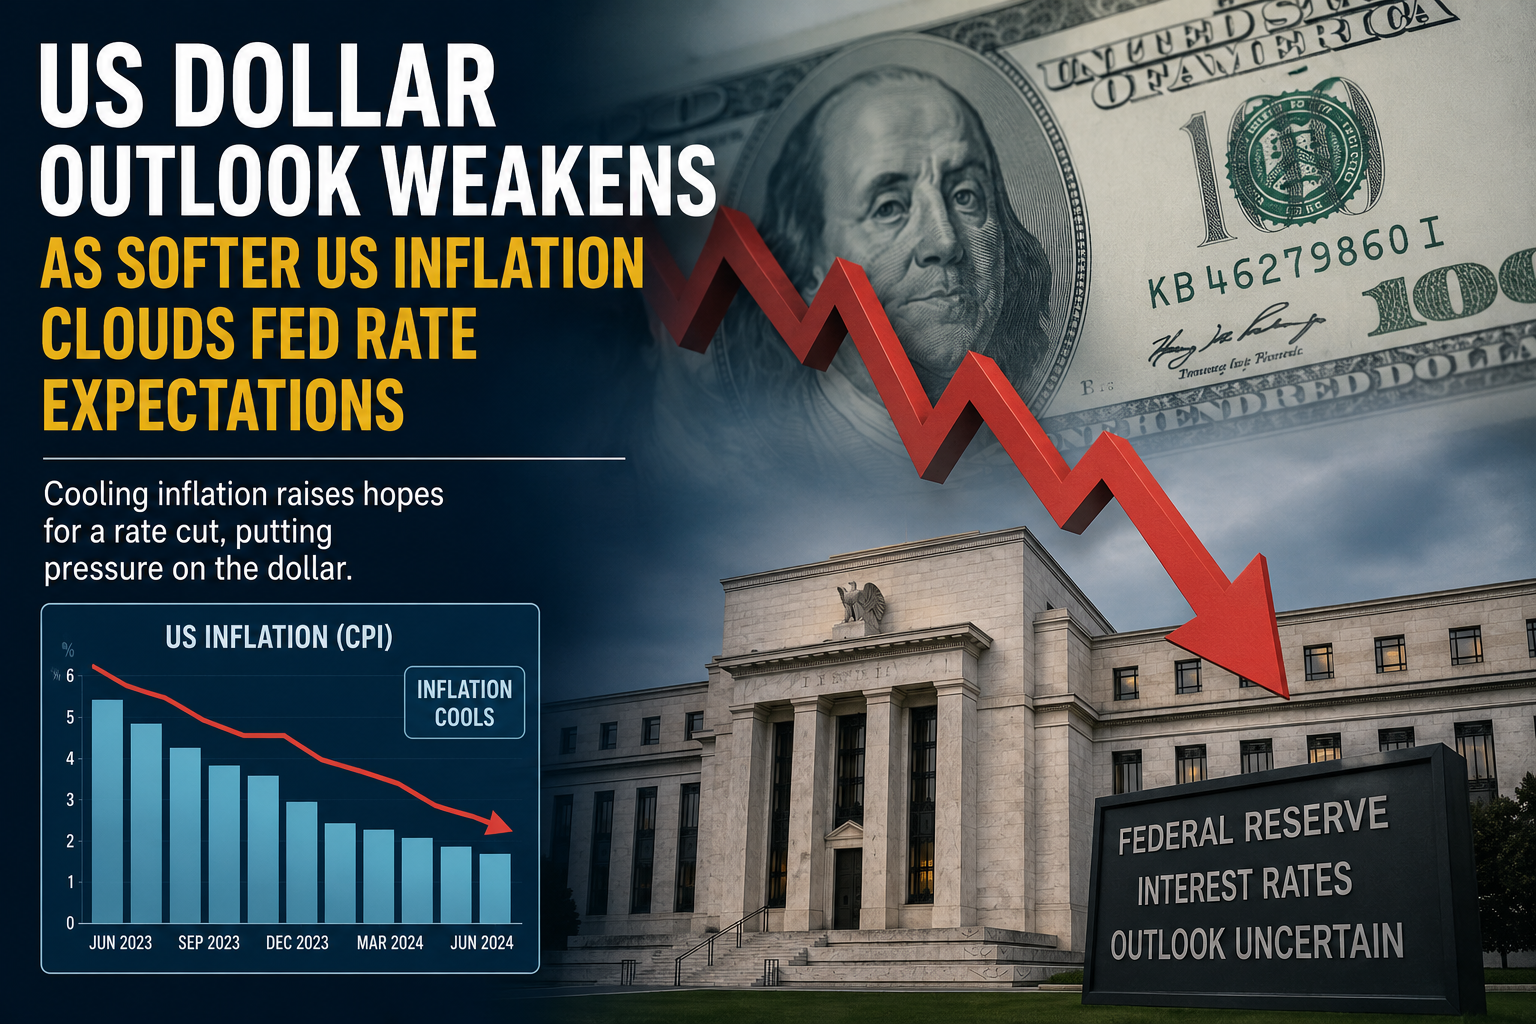
The relationship between gold and the US Dollar continues to play an important role in price direction. A weaker dollar often supports higher gold prices, while a stronger dollar can limit gains. Traders should also keep an eye on US Treasury yields, inflation expectations, and central bank commentary, as these factors frequently influence demand for safe-haven assets. Monitoring these key support and resistance levels can help traders identify potential breakout opportunities and manage risk more effectively in the current market environment.