Last Updated on August 19, 2026 by Deon
The ICT trading strategy is based on the idea that the price of something can give us clues about what is going on in the market. This strategy is about looking at how the price is moving and using that information to make decisions about when to buy or sell.
Instead of just using indicators to decide when to trade, ICT traders wait for the price to reach a certain point and then look for confirmation that it is a good time to trade. This approach is more structured. It also requires a lot of patience. A trader may have to wait for a time for the right conditions to come along.
The strategy that is described here is a framework for learning and testing. It is not a promise that you will make money. You can use **MT4 and MT5** to test this strategy and see how it works.
What Is an ICT Trading Strategy?
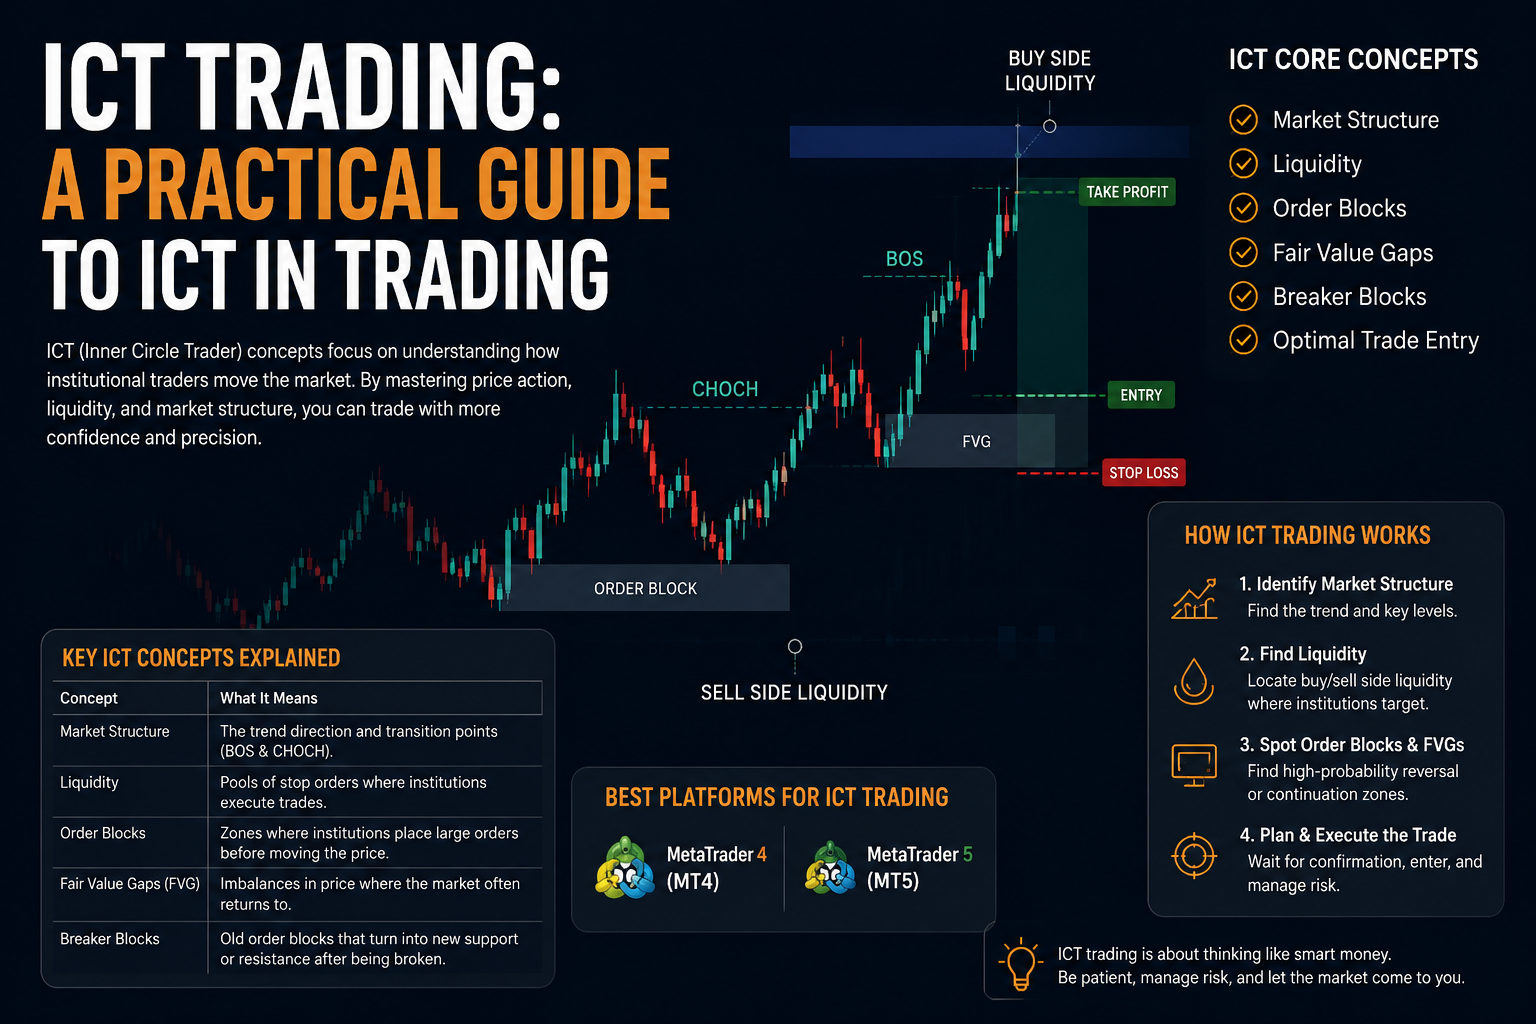
An ICT trading strategy is a way of trading that combines different ideas about price action into one process. This process includes things like:
1. Looking at the picture to see which way the market is moving
2. Identifying areas where there is a lot of liquidity
3. Waiting for a liquidity sweep
4. Looking for a break of structure or a shift in the market
5. Watching for displacement
6. Identifying fair value gaps or order blocks
7. Setting a stop-loss
8. Setting a profit target
Different traders may have rules for their ICT trading strategy. The important thing is to create rules that’re clear and that can be tested.
Step 1: Identify the Market Direction
To start you need to look at the picture. Look at the timeframe and see if the price is making higher highs and higher lows or lower highs and lower lows. This will give you a sense of which way the market is moving.
For example if the market is bullish, you may want to look for buying opportunities after the price has dropped down to a level with a lot of liquidity. If the market is bearish, you may want to look for selling opportunities after the price has moved up to a level with a lot of liquidity.
This does not mean that you should always buy in a market or sell in a bearish market. It just gives you a sense of which way the market is moving.
Step 2: Mark Liquidity
Liquidity is a part of many ICT trading strategy models. You need to identify areas where there is a lot of liquidity. These areas can include:
swing highs
Previous swing lows
Equal highs
Equal lows
Previous day high
Previous day low
Important session extremes
These levels can help you understand where the price may encounter increased activity.
Do not mark every high and low point. Many levels can make the chart confusing and reduce the quality of your analysis.
Step 3: Wait for a Liquidity Sweep
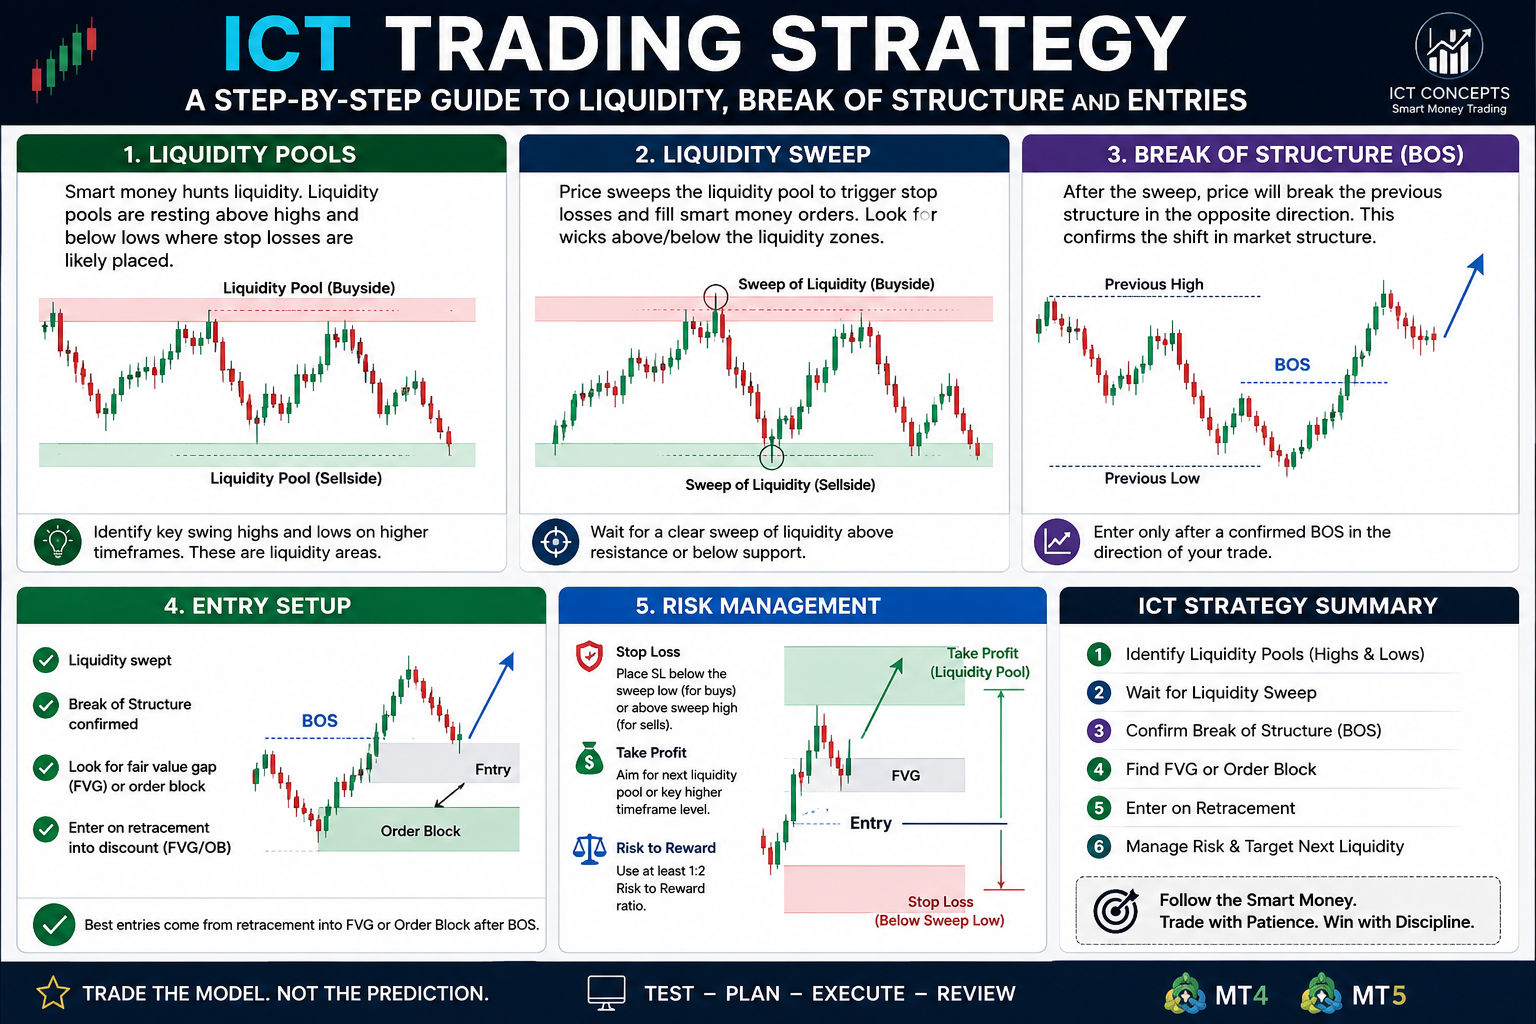
One common **ICT setup** involves a liquidity sweep. This is when the price moves down to a low and then quickly moves back up above it. This can be a sign that the market is getting ready to move in a direction.
A sweep alone is not enough to enter a trade. You need to wait for confirmation from the price behavior.
Step 4: Look for Break of Structure
After a liquidity event, you can watch for a break of structure. This is when the price moves up or down and breaks through a level of support or resistance.
For a setup the price may sweep a previous low and then break above a recent short-term high with strong momentum. For a setup the price may sweep a previous high and then break below a short-term low.
This sequence can provide confirmation than entering immediately after the liquidity sweep.
Step 5: Watch for Displacement
Displacement refers to an decisive price movement. In an ICT trading strategy, displacement can help distinguish a meaningful market reaction from a weak bounce.
A strong move that breaks structure may leave behind an imbalance or fair value gap. Of course, you may want to wait for the price to retrace back to the identified area.
Step 6: Use a Fair Value Gap or Order Block
After displacement a fair value gap may appear. You can mark the zone. Wait for the price to return to it. Some traders combine this with an order block to create a specific entry area.
For example:
Liquidity sweep → Break of Structure → Displacement → Fair Value Gap retracement → Entry
This sequence is easier to test than a rule such as “buy when the chart looks bullish.”
Step 7: Define Stop-Loss and Target
You should decide on your risk before you open a position. For a setup, your stop-loss might be placed beyond a meaningful structural invalidation point. For a setup the same principle applies in the opposite direction.
Your profit target can be based on the significant liquidity area or another predefined technical level.
ICT Trading Strategy Example
Imagine that a currency pair is showing a bullish higher-timeframe structure. The price then moves down to a low. It briefly breaks that low. Then moves back up above it. After the price creates a strong upward move and breaks a nearby short-term high.
Instead of buying immediately, you wait for a retracement. If a fair value gap forms during the displacement, that area can become a potential entry zone.
You then define your entry level, stop-loss level, profit target and acceptable risk. If the price returns to the zone and the setup remains valid, you can consider entering the trade according to your predefined rules.
If the market invalidates the setup you accept the loss than moving your stop-loss just to avoid being stopped out.
Using MT4 and MT5 for ICT Analysis
Both MT4 and MT5 can be used to practice an **ICT trading strategy**. You can use the charts to mark liquidity levels, identify market structure, draw fair value gap zones, and monitor entries.
A useful practice is to save chart examples and review them later. This helps you determine whether your setup actually performs consistently or only looks attractive after the fact.
Trading Every Liquidity Sweep
A liquidity sweep does not automatically create a trade. You should wait for confirmation.
Using Many Concepts
Adding every ICT concept to one chart can make analysis unnecessarily complicated. Start with a number of clearly defined conditions.
Ignoring Higher-Timeframe Context
A setup on a low timeframe can be misleading when it goes against the broader market structure.
Moving the Stop-Loss
Changing your stop-loss because the trade is losing can turn a planned loss into a much larger one.
Entering Too Early
Patience is a part of this methodology. Waiting for the sequence can reduce impulsive entries.
Final Thoughts
A defined ICT trading strategy can give traders a structured way to study liquidity, market structure, displacement, fair value gaps and potential entry areas.
The biggest lesson is that no individual ICT concept should be treated as a guaranteed signal. A liquidity sweep can fail. A fair value gap can fail. A break of structure can become a breakout.
Successful trading therefore requires more than identifying patterns. Risk management, patience, consistency, and proper testing are equally important. MT4 and MT5 offer environments for chart analysis and strategy testing. Traders should focus on building one setup documenting its results and improving their process over time.