Last Updated on June 29, 2024 by Deon
Have you ever heard the phrase; A picture is worth a thousand words? Well, that’s also true when it comes to trading and the financial markets. With this Hidden Divergence Cheat Sheet, you can quickly spot divergences and know exactly what they mean. This will enable you to find high probability trading opportunities in the market on a daily basis with ease, which should result in improved performance if used correctly. With that in mind, let’s get right into it!
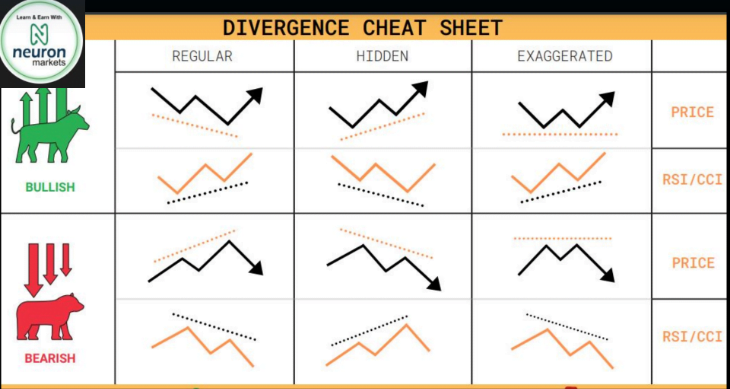
Hidden Divergence Cheat Sheet Guide
- Look for a market that is trending: You can use trend lines or moving averages to help you identify a market that is in an uptrend or downtrend.
- Identify divergence on the chart: This is when the price action and the indicator move in opposite directions
- Enter a trade in the direction of the trend: If you see divergence on a chart, it’s a signal that the current trend might be coming to an end.
Hidden Divergence
A hidden divergence is when a divergence becomes out of favor or it has stopped forming. This could happen because the market has reversed a prior trend, sentiment changed drastically in regards to a specific sector, or another external factor was able to change the course of what would have been an expected continuation of a pattern.
Bullish Candlestick Patterns
Divergences have been around for a long time in forex trading. They occur when price fails to continue the same direction it was moving before the divergence. Bullish candlestick patterns are indicative of hidden divergences, where two peaks are followed by a downward-sloping trough. The larger the gap between the highs and lows, as well as their corresponding shadows (or wicks), the more likely that a bullish divergence is taking place. There is also an upper boundary on how high prices can climb during this type of setup—a bull will never extend beyond his limits!
Enter in trade with Divergence Cheat Sheet
Enter a trade based on the Divergence Cheat Sheet: If you see divergence, you can enter a trade based on the setup outlined in the Divergence Cheat Sheet. This will help you take advantage of reversals in the market and make money even when the overall trend is down.
How to spot Hidden Divergence?
- Look for a change in direction: When the market is going up, but the indicator (RSI, MACD) is going down, it’s called bearish divergence.
- Check for volume changes: If the indicator diverges from price but there’s no change in volume, it might not be as significant.
- Consider other factors: There might be other reasons for the divergence that have nothing to do with an impending reversal.
Frequently Asked Questions:
Q. What is the best way to use the Hidden Divergence Cheat Sheet?
Answer: You can plot trend lines on chart then spot the difference in direction on higher highs or lowers on the indicator.
Q. How to use Hidden Divergence Cheat Sheet in forex trading?
Answer: The Hidden Divergence Cheat Sheet is a great resource that helps people quickly identify the hidden divergence in forex trading. It’s a simple, one-page cheat sheet with easy-to-read graphics and all the information you need.
Q. Why do we use hidden divergence cheat sheet?
Answer: You can use this cheat sheet to easily spot the changes in market trend and take buy/sell entries accordingly. The sheet is designed to help you get maximum pips from your forex trades.