Last Updated on September 7, 2026 by Deon
Silver Price Drops Below $66 as Bearish Forces Take Control
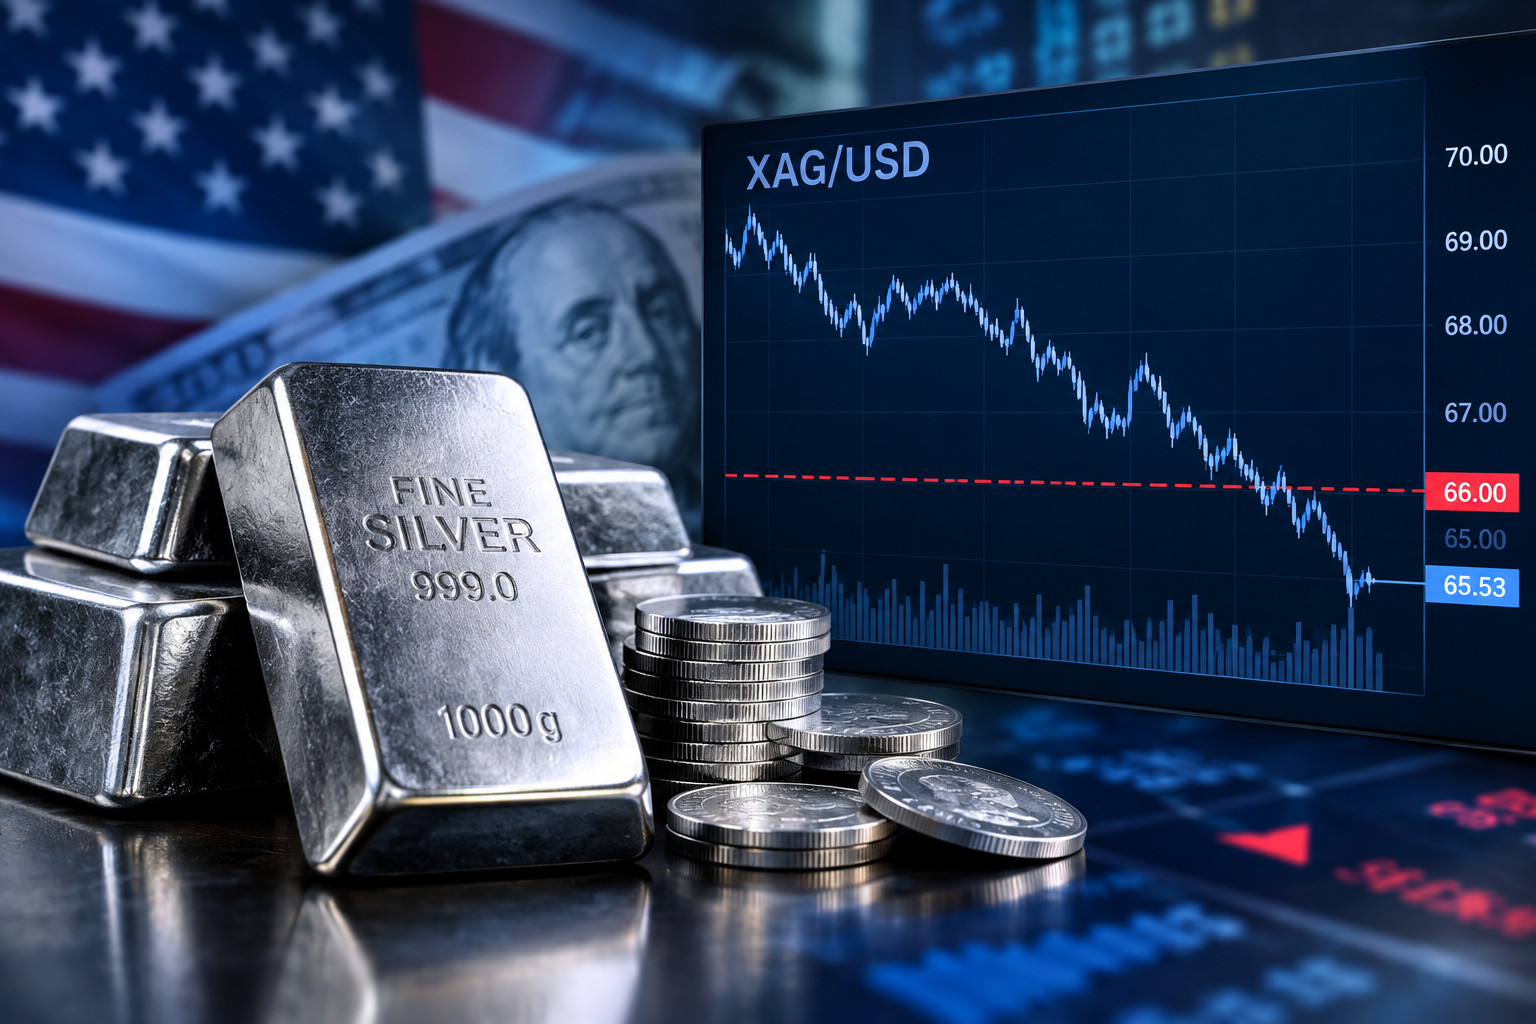
Silver price (XAG/USD) started the week with pressure dropping below the $66 mark after failing to maintain its recent gains. The precious metal moved toward the middle of the $65 range as traders responded to than-expected US employment data.
According to FXStreet XAG/USD hit a session near $65.46 after turning back from the $68 area on Friday. The drop has raised worries that silver might see losses if sellers continue to dominate the market.
Us Jobs Data Pressures Silver
One major reason for the latest drop in silver is the strong US Nonfarm Payrolls report. US employment rose by 162,000 in August higher than the expected 57,000.
These better labor market numbers reduced worries about a slowdown in the US economy and increased expectations that the Federal Reserve might keep monetary policy tight.
Markets have raised the chance of a 25-basis-point Fed rate hike at the September 15–16 meeting to 58% up from around 50% before the jobs report.
Higher expectations for interest rates can put pressure on silver because the metal does not provide interest income. Higher yields can therefore make non-yielding assets less appealing.
US Inflation Data May Determine the Next Move
The next major event for traders is the US Consumer Price Index report coming later this week.
Inflation data could have an effect on expectations for the Federal Reserves decision in September. Higher-than-expected inflation could support the US Dollar and Treasury yields increasing pressure on XAG/USD.
On the hand lower inflation could reduce the chances of a rate hike and give silver buyers a chance to recover.
XAG/USD Technical Outlook Turns Negative
Looking at the side silver is showing signs of more downward pressure. XAG/USD is trading below its 200-day moving average and the recent reversal from around $68 has increased the chance of a bearish Head and Shoulders pattern.
The daily Relative Strength Index is near the 52 mark and the MACD is still in negative territory. This mix suggests that bullish momentum is not strong enough to confirm a recovery.
$63.30 Is the Key Support Level
The $64.75 area, to Fridays low is the first area where the price could find support.. The more important technical level is around $63.30, which matches the September 2 low.
A clear break below $63.30 could confirm the Head and Shoulders formation. If that happens silver could potentially move toward the $61.00 level, which’s near the August 6 low.
Resistance Levels to Monitor
On the upside silver faces resistance around $67.50. This area previously acted as support. Could now serve as resistance. A move above $67.50 could improve the short-term outlook. Bring the $68.00 level back into focus. Further gains could take the price toward the mid-June highs near $71.60 followed by the 200-day SMA around $72.90.
Silver Price Prediction
The short-term outlook for silver is cautious to bearish while XAG/USD is below $67.50 and its 200-day moving average.
A drop below $64.75 could increase selling pressure while a move under $63.30 would send a bearish technical signal. Traders will also closely watch the US inflation data as it could affect expectations about the Feds next decision.
For those who want silver to rise taking back $67.50 would be a first step in reducing the current bearish pressure.
Key Levels to Watch
Level Importance
$72.90 200-day SMA / resistance
$71.60 June high
$67.50 Initial resistance
$66.00 Psychological level
$64.75 Near-term support
$63.30 Key H&S neckline
$61.00 Potential downside target
Final Summary
Silver is still under pressure after falling below $66 and reversing sharply from the $68 area. Strong US employment data has made it more likely that the Federal Reserve will keep policy tight which is not good news for precious metals.
Technically the possible head and Shoulders pattern makes $63.30 a level for traders. A drop below that could lead the price toward $61.00 while a recovery above $67.50 would help reduce the setup.
Traders should therefore keep an eye on US inflation data and the key technical levels before trying to figure out the major move, in XAG/USD.