Last Updated on May 4, 2026 by Deon
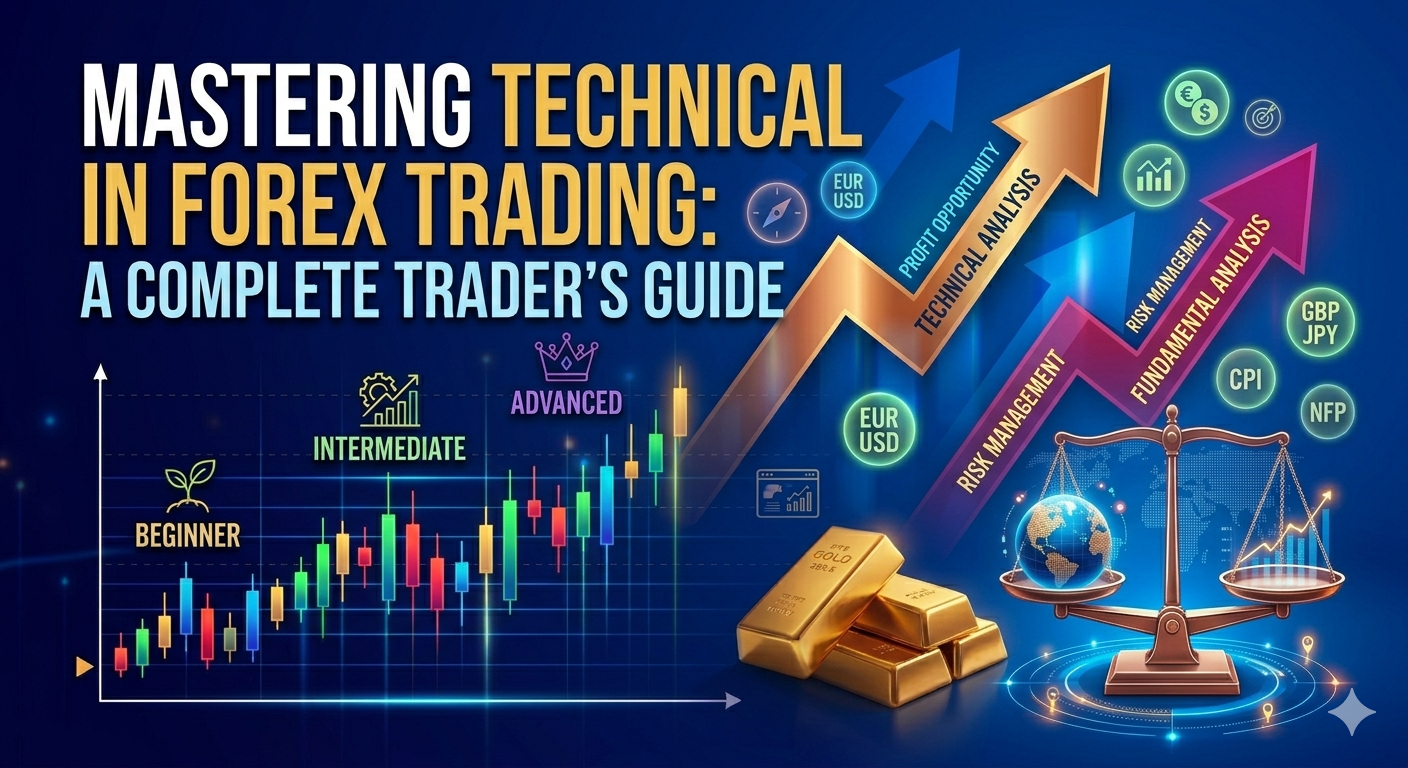
Technical analysis is a powerful tool for people who trade forex. It helps traders understand how prices move find trends and make decisions based on what happened in the past rather than just guessing or following their emotions. Whether you are just starting out or you have been trading for a time learning about technical analysis can really improve your results especially if you use a good platform like Neuron Market.
What Is Technical Analysis?
Technical analysis is when you study what happened in the market in the past mostly looking at prices and volume to try to figure out what will happen to prices in the future. Of paying attention to news or economic trends traders look at charts and patterns to find good times to trade.
The basic idea is simple: things that happened in the past tend to happen in the financial markets and prices often follow patterns that we can recognize.
Key Principles of Technical Analysis
1. The Price Says It All
Everything that is known whether it is about the economy, politics or peoples feelings is already included in the price. Traders only look at what the price’s doing.
2. Trends Are Important
Markets usually move in trends either going up going down or staying the same. If you can find the trend early you can trade with the market of against it.
3. History Repeats Itself
Things that happened in the past like patterns and the way people behave tend to happen. This helps traders predict what will happen next.
Essential Tools in Technical Analysis
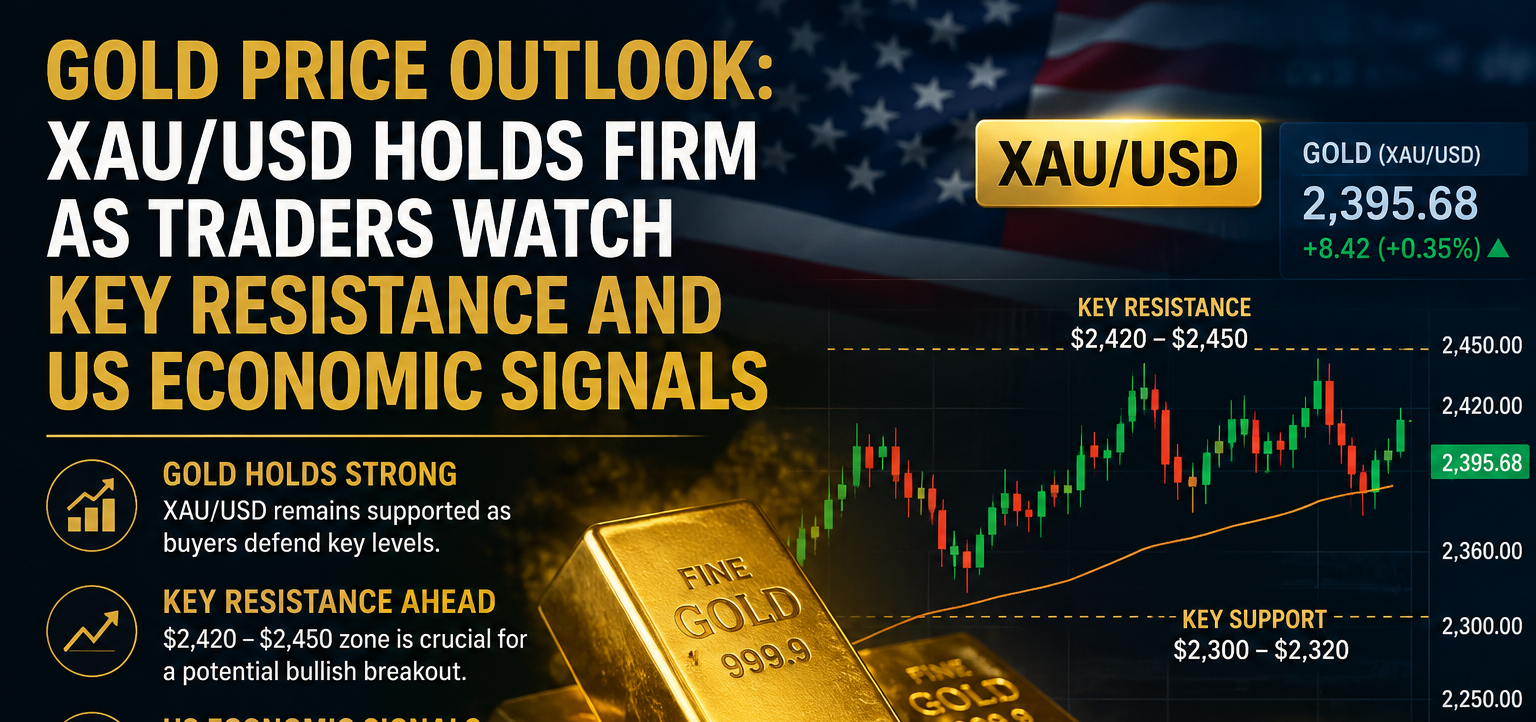
1. Support and Resistance
Support is a price level where the market tends to stop falling. Resistance is a level where the price has trouble rising above. These levels help traders decide when to get in and out of a trade.
2. Trend Lines
Trend lines are lines that connect the highs or lows helping traders see which way the market is going.
3. Indicators
Indicators give traders confirmation about what to do. Some popular ones are:
Moving Averages
RSI or Relative Strength Index
MACD or Moving Average Convergence Divergence
On platforms like Neuron Market these indicators are easy to use and can be customized for any trading style.
Popular Chart Patterns
1. Reversal Patterns
These patterns show that the trend might be changing:
Head and Shoulders
Double Top or Double Bottom
2. Continuation Patterns
These patterns show that the trend will keep going:
Flags
Pennants
Triangles
If traders can recognize these patterns they can time their trades better.
Types of Forex Charts
1. Line Chart
This chart is simple. Shows the closing prices.
2. Bar Chart
This chart shows the high, low and close prices.
3. Candlestick Chart
This is the popular chart and it gives a lot of information about how the market is feeling.
Most traders like candlestick charts, which’re available on Neuron Market because they are clear and easy to use.
Check this link: Best forex broker in Pakistan
Timeframes in Technical Analysis
The timeframe you choose depends on your trading style:
Scalpers use charts that show 1 to 5 minutes
Day traders use charts that show 15 minutes to 1 hour
Swing traders use charts that show 4 hours to 1 day
Looking at timeframes can help confirm trends and make trading more accurate.
Advantages of Technical Analysis
Helps traders find entry and exit points
Works in any market conditions
Can be used with any currency pair
Helps traders make decisions based on facts, not emotions
Limitations to Keep in Mind
Technical analysis is not perfect. Markets can be unpredictable. Sometimes the signals are wrong. That is why traders often combine analysis with good risk management and discipline.
Final Thoughts
Technical analysis is a skill for anyone who wants to trade forex seriously. By learning about charts, patterns and indicators traders can make decisions and be more consistent over time.
Using a trading platform, like Neuron Market can make technical analysis even better with advanced tools real-time data and an interface that is easy to use.