Last Updated on March 14, 2024 by symip
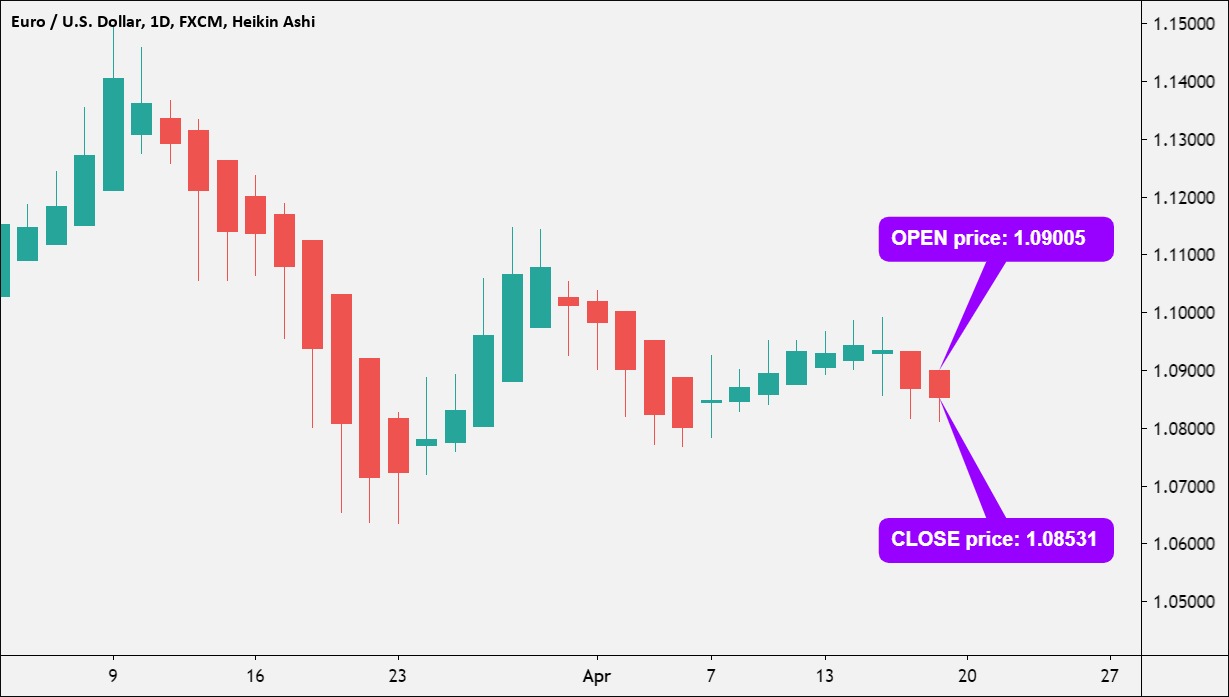
Heikin-Ashi candlestick charts are a hybrid charting system that combines the best of line, bar and candlestick charts. Heikin Ashi were developed in Japan by Goichi Hosoda and published in his book Nihon Chiri Gaku (The Japanese Charting Method). It is common to use Heikin-Ashi to represent oscillator data such as moving averages or stochastics. It is a charting tool used to portray the movement of price over time. The chart is similar to a candlestick chart except it displays an average price over the given period of time instead of the prices at specific periods in time.
Also read:Candlestick Anatomy
Interpretations of Heikin Ashi Candlestick
Heikin Ashi Candlestick can be interpreted as:
- If the candlesticks are green with long bodies, then it is interpreted as uptrend
- If the candlesticks are red with long bodies, then is interpreted as downtrend
- If the candlesticks have short bodies and is surrounded by upper shadows and lower shadows then it is interpreted as trend change or trend pause
- When the candlestick is green without lower shadows then it is interpreted as strong uptrend
- When the candlestick is red without upper shadows then it is interpreted as strong downtrend
Trading 3-Time Frames
Calculations of Heikin Ashi Candlestick
Candlesticks, a Japanese derivative of western bar charts, are used to display financial market data. Heikin Ashi candlestick charts use the same body and shadow as regular candlestick charts, but instead of showing open-close compartments for each period, they show high-low ranges for each period. The calculated range is then added or subtracted from the open price to determine the final candle’s value. There are many ways to calculate a Heikin Ashi candlestick chart.
- To open your previous candlestick, the formula is (Open + Close)/2
- When your current candlestick is at the highest point then its price is high
- When your current candlestick is at lowest point then its price is low
- To close your current candlestick, the formula is (Open + High + Low + Close)/4
Descending channel patternHidden Divergence cheat sheet
Disadvantages of Heikin Ashi
Heikin Ashi is a candlestick pattern that shows the average price movement over a certain period of time. It’s based on smoothing out prices, so it works best when there’s some kind of trend happening in the market. If there isn’t any clear direction, then it might be hard to use this indicator properly.
So, since Heikin Ashi smooths out prices, it can be late in identifying trend reversals – so if you’re in a trade and using this pattern as part of your trading strategy, then you might end up getting a late signal to close your position and giving up some unrealized profits along the way. Here are some Heikin Ashi disadvantages
- 1. Slow-moving price indicators are only useful when prices are trending.
- 2. Heikin Ashi smooths the price which means it can be prone to being late in identifying trend reversals, which means if you’re in a trade, you’ll end up with a late signal to close it and end giving up some unrealized profits.
- 3. It’s not ideal for very short-term trading and scalping since there is some lag between actual price movement and what is reflected on the indicator.