Last Updated on March 14, 2024 by symip
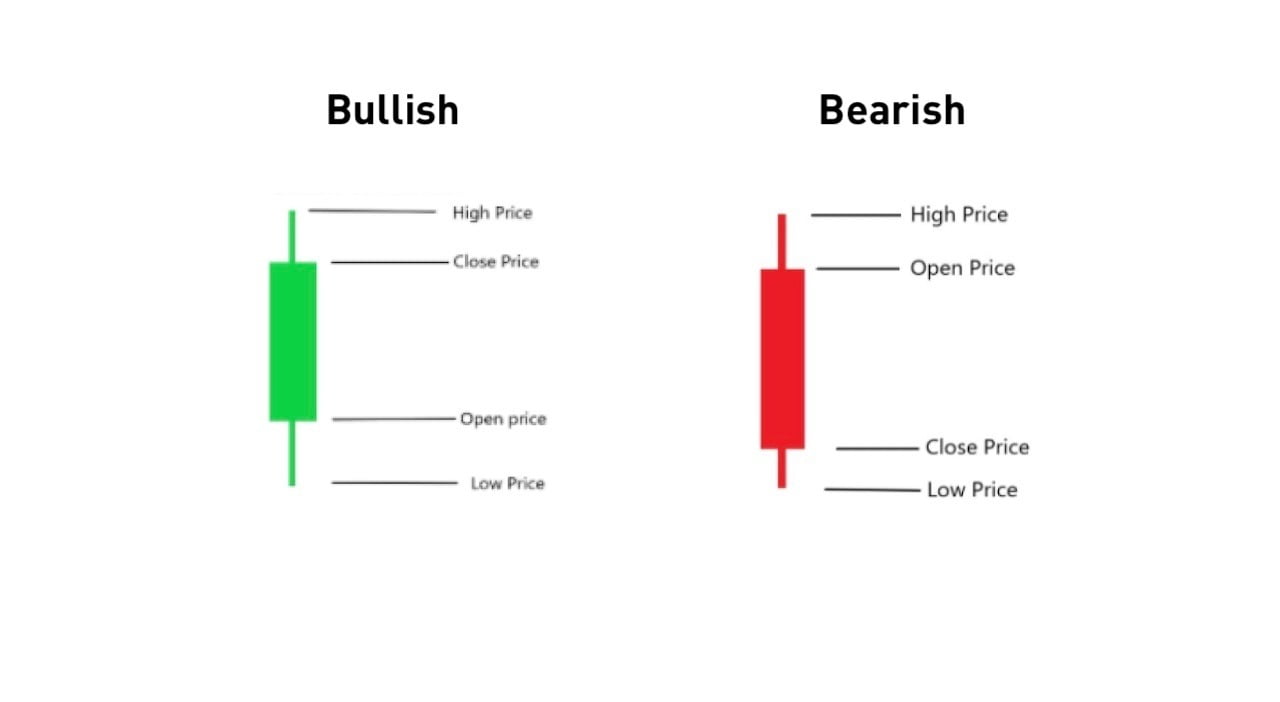
Candlestick Anatomy
Looking for a new, fast and easy way to learn how to trade with Candlesticks? The common belief is that when trading with candlesticks all you need is a candle pattern dictionary. You may open up any book on candlesticks and get overwhelmed by the number of patterns. This is because people who have written these books have compiled their own list of patterns from years of experience. As such the list will vary from author to author and there are simply far too many patterns to learn.
Candlestick Anatomy is a guide to learning candlestick patterns and their meanings. You’ll learn the exact meaning of each candlestick pattern, when to enter a trade, when to exit it, and with what strategy.
Different bodies
The concept of candlesticks was originally developed by Japanese rice merchants in the 17th century to measure the price and activity of rice. It soon became a popular method for investors to understand how much buying or selling pressure there is behind a stock, currency, commodity or option.
When we look at a candlestick chart, there are different patterns that may help us predict the price action in the future. These patterns help us to read and analyze candlesticks. Traders use candlestick charts when analyzing market data for various types of assets such as stocks or forex.
Long vs. short bodies
The length of the body indicates how much activity there was during that time period. A long body means there was a lot of buying or selling pressure; this means either bulls or bears were strong and took control. A short body implies very little buying or selling activity. In trading lingo, bulls mean buyers and bears mean sellers.
Long bodies are associated with high volume (more people trading) than short bodies because there’s more excitement about a trend happening! People want to get in on the action because they know something big is about to happen! Long bodies also indicate greater intensity in either direction; for example, buyers or sellers were stronger and took control of the price movement during that time period.
Upper shadows vs. lower shadows
An upper shadow indicates that the price fell below the opening price but then went back up to close near the opening price. A lower shadow indicates that the price went above the closing price but then fell back down to close near the closing price.
A long upper shadow means that there was a lot of activity at or near the open (i.e., lots of buyers and sellers); this indicates bullish sentiment for the day. A long lower shadow means that there was a lot of activity at or near the close (i.e., lots of buyers and sellers); this indicates bearish sentiment for the day.
A short upper shadow means that there wasn’t much activity at or near the open; this indicates neutral sentiment for the day. A short lower shadow means that there wasn’t much activity at or near the close; this indicates neutral sentiment for the day.
Candlesticks anatomy are a great tool to analyze market sentiment. A candlestick is not just the body of the candle, which represents the opening and closing price, but also the entire candlestick. The real power of candlesticks comes from understanding what role each part plays in telling you about the balance between buyers and sellers at a given point in time. Formation of candles matters more at specific support and resistance levels.