Last Updated on October 17, 2026 by Deon
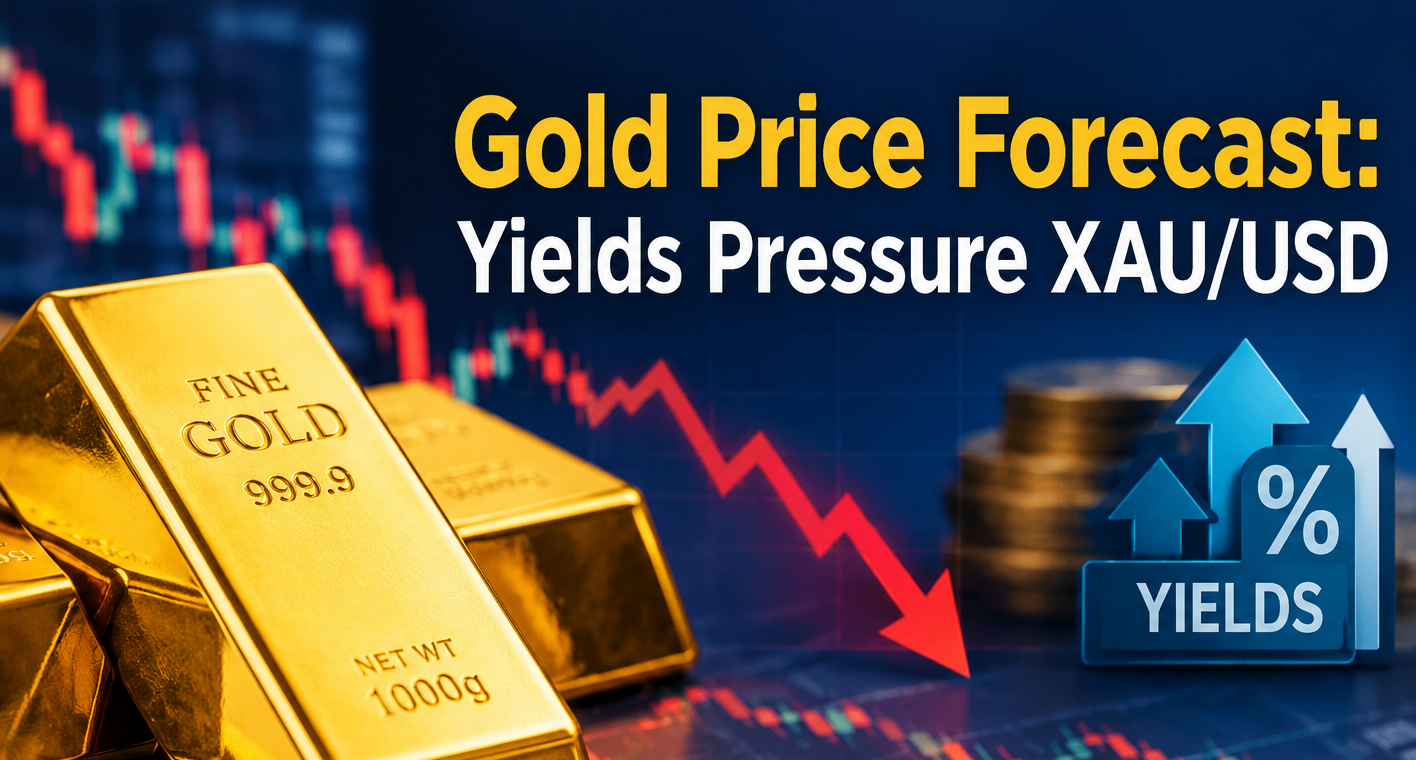
Gold prices stayed under pressure on Friday because rising US Treasury yields pushed back expectations for a Federal Reserve rate hike in October. XAU/USD traded near $4,163. Gold was moving toward a weekly loss.
The market has been looking closely at the US inflation numbers. September consumer inflation was 3.7% year over year higher than the 3.6% forecast and higher than August’s 3.4%. Producer inflation was even stronger with the Producer Price Index climbing 6.3% year over year versus an expected 5.3%.
Even though inflation data was hot traders have lowered expectations for a Fed rate increase. This has kept the US Dollar from gaining but higher Treasury yields still make a tough environment for Gold, which does not yield.
US Yields Remain a Major Headwind
The US 10-year Treasury yield rose to about 5.106% up three basis points. Higher yields can weigh on Gold because Gold does not pay interest.
When bond yields rise investors may prefer interest‑bearing assets over holding a non‑yielding asset like Gold. This link has become especially important as markets rethink the Federal Reserve’s policy moves.
The US Dollar Index was 101.87 and a little lower that day. A softer Dollar would normally help Gold. The rise in Treasury yields has limited Gold’s ability to recover.
October Fed Hike Bets Fade
Market expectations for an October Federal Reserve rate increase have shifted a lot.
After the than-expected inflation numbers traders first raised bets on an October hike to about 60%. Later those bets fell as analysts and financial institutions moved their forecasts toward a December move.
Money markets now see about a 16% chance of a 25‑basis‑point rate increase in October while the chance of a December hike stays much higher at about 89%.
This shift has stopped the inflation data from keeping the US Dollar on a sustained rise. Still Gold has also struggled because Treasury yields stay high.
Gold Technical Outlook
From a point of view XAU/USD keeps trading inside a wide $4,100‑$4,200 range.
Gold has found it hard to break above $4,200 which’s the first big resistance for buyers. A steady move over this level could make the short‑term outlook better. Bring other resistance levels into focus.
The next barrier on the upside is the 100‑day Simple Moving Average to $4,242. If buyers can move past that level the 50‑day SMA around $4,331 becomes the key target.
Above the moving averages the psychological $4,500 level could matter if bullish momentum comes back.
The RSI stays bearish though a mild positive divergence shows up. That divergence could help a recovery if buyers start coming to the market.
$4,100 Is Key Support
On the downside traders are watching $4,100 closely.
A clear break below this level could show that sellers are gaining control.
The next support zone is around the October 14 near $4,073.
If selling pressure keeps going below $4,073 attention could move to the July 29 cycle near $3,996 then to the July 17 low near $3,959.
The yearly low near $3,941 is another downside reference if the overall decline speeds up.
US Data Remains in Focus
The next phase of Gold trading will probably stay closely tied to US data and Federal Reserve expectations.
Recent industrial production data showed a than-expected 0.7% monthly rise in September versus an expected 0.4%. The month before recorded 0.1% growth.
Week traders will look at US housing figures, Initial Jobless Claims and Flash Purchasing Managers’ Index data. These releases could change expectations for interest rates and Treasury yields adding volatility to Gold.
The short‑term Gold price forecast stays cautious while XAU/USD stays below $4,200. Higher US Treasury yields are still limiting Gold’s recovery even though expectations, for an October Fed hike have faded.
I think an upward move above four thousand two hundred dollars could strengthen the case and expose four thousand two hundred forty-two dollars and four thousand three hundred thirty-one dollars. I see that a sustained break, below four thousand one hundred dollars could increase selling pressure toward four thousand seventy-three dollars and three thousand nine hundred ninety-six dollars.
For now the four thousand one hundred to four thousand two hundred range remains the area to watch as traders assess US yields, Federal Reserve expectations and upcoming economic data.