Last Updated on September 29, 2026 by Deon
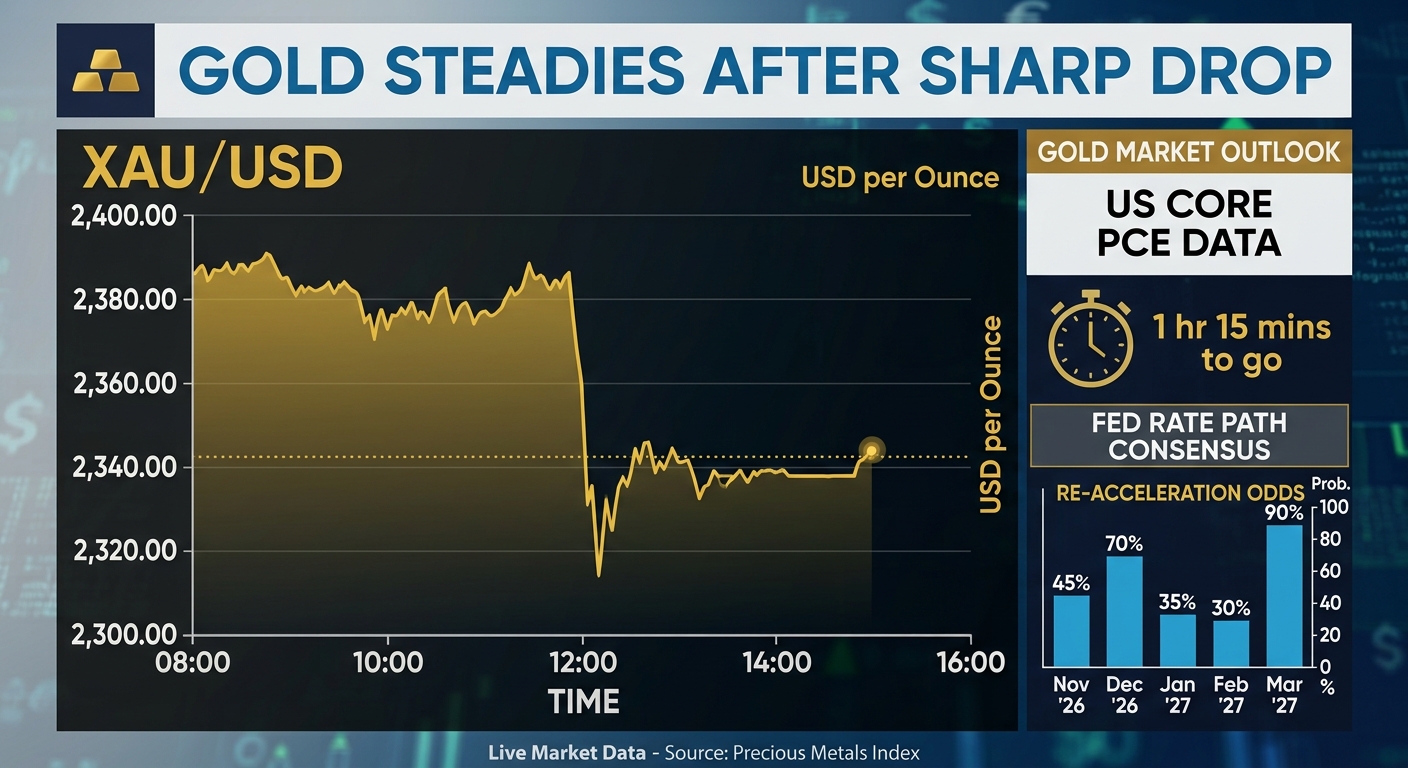
Gold stabilizes after a drop at the start of the week. XAU/USD is now around $4,152 on Tuesday up 0.90%. This follows a fall on Monday, when prices dropped nearly 4% and hit a seven-week low near $4,110. The move Tuesday looks like a pause than a true turnaround. Traders are still weighing how the market will react to a range of forces. The recovery has not gained strength so far. One of the reasons gold is under pressure is the outlook for Federal Reserve interest-rate policies. Markets now see a chance of another rate hike in October. According to the CME FedWatch Tool the probability of a hike was 72% at the time of reporting. Higher interest rates make gold less attractive because gold does not pay interest. When yields on government bonds rise investors are more likely to move money into those assets of holding gold. That shift in investor behavior puts pressure on gold prices.
US Treasury Yields Remain Elevated
US Treasury yields have risen sharply adding to the pressure. The 10-year US Treasury yield is around 5.24% below its Monday peak of 5.27%. That level is the highest since 2007. Higher yields make US government bonds more appealing compared to gold. In weeks bond prices have fallen due to inflation concerns, which in turn supports higher yields. For gold traders the path of Treasury yields will stay a factor. If yields keep climbing gold could face selling.. If yields fall the downside pressure might ease.
The situation in the Middle East is another factor affecting gold. The ongoing tensions between the US and Iran are keeping oil prices high. There are fears about disruptions around the Strait of Hormuz a route for oil shipments. Higher oil prices can push inflation higher because they increase costs for fuel and transportation. That inflation risk makes investors look for safe-haven assets like gold.
Middle East Risks Keep Oil Prices Elevated
Iran’s Foreign Minister, Abbas Araghchi said Tehran has held talks with the US through Qatar. He said Iran is waiting for Washington’s response to a proposal about the Strait of Hormuz. At the time President Donald Trump denied reports that the US had offered Iran sanctions relief or access to frozen funds. The lack of progress between the two countries means uncertainty over oil supplies could continue. That uncertainty may keep oil and inflation concerns in play.
Traders are now entering a period for US economic data. The US Conference Board Consumer Confidence Index and JOLTS Job Openings data are on the schedule. Several Federal Reserve officials are also set to speak. Later in the week the focus will shift to the Personal Consumption Expenditures (PCE) Price Index, ISM Manufacturing PMI and the US Nonfarm Payrolls report. These reports could shape the outlook for Fed policy. Strong data may support interest rates, which would hurt gold. Weak data could ease some of the pressure on gold.
The US Dollar is also adding pressure. The US Dollar Index (DXY) is around 101.40 close to two-month highs. A stronger dollar makes gold more expensive for buyers using currencies. When the dollar strengthens demand for gold often drops. The combination of a dollar and high Treasury yields is especially tough for gold. Even if geopolitical risks rise and push investors toward safe-haven assets, a strong dollar and high yields can limit gold’s ability to rise.
Strong Dollar Adds More Pressure
The US Dollar is also adding pressure. The US Dollar Index (DXY) is around 101.40 close to two-month highs. A stronger dollar makes gold more expensive for buyers using currencies. When the dollar strengthens demand for gold often drops. The combination of a dollar and high Treasury yields is especially tough for gold. Even if geopolitical risks rise and push investors toward safe-haven assets, a strong dollar and high yields can limit gold’s ability to rise.
Technically gold remains in a position. It is trading below the middle and upper Bollinger Bands on the daily chart. The 14-period RSI is around 37 close to levels. The MACD is still negative. The first resistance level is around $4,157 near the Bollinger Band. Above that the middle band at $4,325 and the upper band at $4,494 are levels to watch. On the downside support is near $4,100. Below that the $4,000 level is a psychological barrier. A break below $4,000 could signal weakness. The RSI nearing oversold levels might allow short-term rebounds. It does not guarantee a trend reversal.
Traders should keep an eye on key factors. First expectations for Fed rate hikes. Higher expected rates continue to weigh on gold. Second US Treasury yields. Rising yields increase the cost of holding gold. Third US Dollar strength. A stronger dollar makes gold more expensive. Fourth developments in the Middle East. Any change around the Strait of Hormuz could affect oil and inflation. Fifth US economic data. JOLTS, PCE, ISM and Nonfarm Payrolls could influence Fed policy. Finally technical levels. $4,100 And $4,000 are support points.
Looking ahead gold has stabilized after Monday’s drop but the overall market is still under pressure. The mix of Treasury yields, a strong dollar and expectations for more Fed rate hikes is making life difficult for gold. At the time geopolitical risks and high oil prices are still playing a role. A major shift in the US-Iran situation could quickly change the picture for oil, inflation, yields and gold. For now traders are focused on upcoming US data and Fed commentary. A real recovery in gold will need a change in the interest-rate and yield outlook. If yields and the dollar keep rising gold could remain vulnerable.
FAQs
Why did gold fall sharply?
Gold fell because US Treasury yields rose and expectations for Federal Reserve rate hikes grew stronger.
What is the current gold price area?
Gold was trading around $4,152 when FXStreet published its report on September 29.
Why are Treasury yields important for gold?
Higher yields make other investments more attractive compared to gold, which does not pay interest.
What are the key gold support levels?
The $4,100 and $4,000 levels are support points, in the latest technical analysis.
What data could move gold next?
Traders are watching JOLTS the PCE inflation report, ISM Manufacturing PMI and Nonfarm Payrolls.