Last Updated on May 22, 2025 by Deon
Pips in Forex and CFD trading represent price movement, profit potential, and risk exposure. Yet for new traders, this language of pricing can often seem scary and mysterious. So, the concept of ‘how to calculate Pips in TradingView’ and understanding their meaning may seem like challenging tasks.
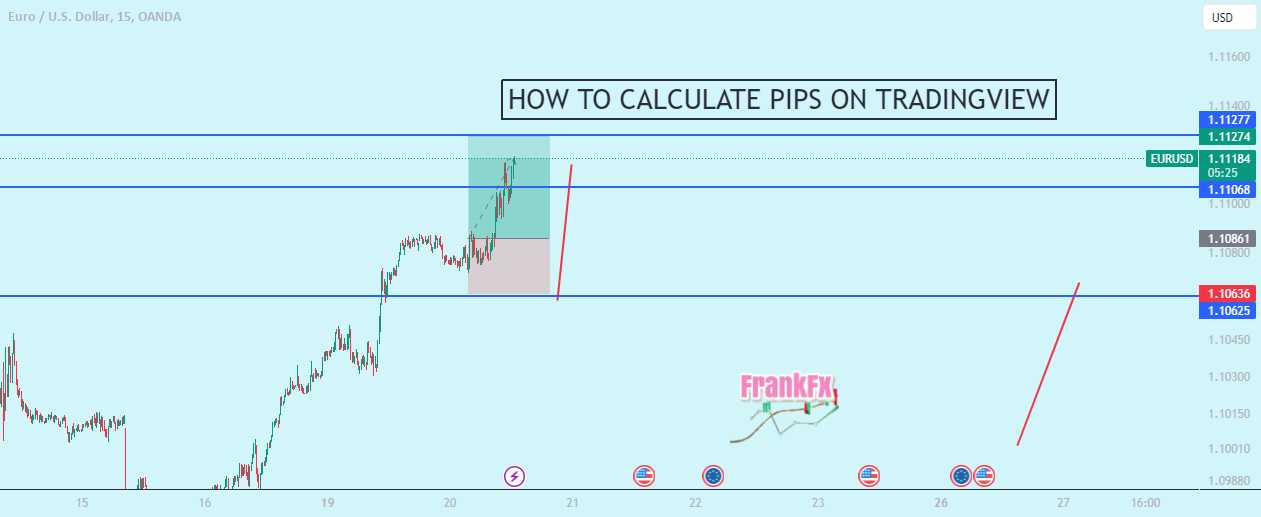
TradingView provides intuitive tools that make Pip calculations quick and simple. This guide will show you how to calculate Pip sizes on charts for greater precision and confidence in trading.
What Does a Pip Mean Precisely?
Pip, short for ‘percentage in point’, represents the minimum standard price change across most currency pairs:
- For standard currency pairs, such as EUR to USD, one Pip represents one-fourth of a decimal place (0.0001).
- For EUR to USD pairs, such as USD/JPY, one Pip represents movements from 1.0751 to 1.0775 in one day.
- In JPY pairs such as USD to JPY, a Pip represents changes at the second decimal place (0.01).
- One Pip equals 0.01 of USD to JPY move: from 155.25-155.26
For other assets like indices or commodities, e.g., US30 and Gold, ‘Pips’ refers to the smallest quoted price increment that may range anywhere between 1.0, 0.1, or even 0.01, depending on your broker.
Quick Pip Calculations with the Measure Tool for How to Calculate Pips in TradingView
TradingView’s Measure tool is perfect for speedy Pip calculations, and here is how it is used:
Activate the Measure Tool
To activate it on the left-hand toolbar, look for the ‘ruler icon’ and click it to make your measure tool active.
Click and Drag on the Chart
To set an entry price and stop-loss price on the chart, start by clicking your starting point, e.g., entry price, and dragging to where your target or stop-loss price lies.
Read the Box
A data box appears with several values inside it:
- ‘The third value’ typically displayed between parentheses represents pip or point movement for currency pairs and automatically adjusts depending on asset format. Example: for EUR/USD Pair_ If the box shows 50 Pips Changed, that indicates price movement by that amount.
- For USD/JPY_ when displayed as a 25-Pip move on a chart that represents 25-Pip movement in either direction.
Precision Tool for Pip Planning Using ‘Price Range’
For deep Pip analyses, i.e., ideal for risk and reward planning, utilize the Price Range tool:
Locate & Select
Locate and Select ‘Price Range’ on the Left Toolbar. It looks similar to a vertical bar chart icon and should appear under your options list on this tab.
Click and Drag
For best results, set both start and end points to your range using click-and-drag technology.
Examine Outputs
Whilst using this tool to analyze heavy output, several parameters will be displayed. Price Change, Percentage Movement, Pip or Point Values are clearly labeled and easily understood, making them helpful tools in analysis.
Use Case
It is ideal for setting and adjusting stop-loss and take-profit zones in pip terms.
Manual Pips Calculation to Strengthen Foundation; Another Important Task for How to Calculate Pips in TradingView
Even though TradingView automates this calculation process, it is beneficial learning how to calculate Pips manually:
Decimal Pairs, e.g., EUR/USD
- Pips = the price changes multiplied by 10,000. So, in the case of 1.0800 – 1.0750,* 10,000 shows a profit of 50 Pips.
- A pip is changed to a price difference multiplied by 100. Similarly, the figure, 156.50 – 156.00.00, multiplied by 100 equals 50 Pips.
This formula can also help when planning trades outside TradingView or validating any Pip counts shown on your chart.
Learning about How to Calculate Pips in TradingView Gives Greater Insights into Market Conditions
Learning Pip calculations is essential to any trader, and with TradingView’s tools, it does not have to be complicated. From quick analysis using the Measure tool or advanced planning and trade management using the Price Range tool, traders will gain greater insights into market movement while improving risk management strategies.