Last Updated on October 15, 2024 by Deon
TradingView is a popular platform that helps traders to know the financial market more accurately. It has many simple and useful features to understand. TradingView chart is one of the main features. With the help of it, custom charts can be created that show price variations and spot patterns. These charts help traders and investors make more informed decisions about trading.
What is a TradingView Chart?
A TradingView chart provides a visual depiction of the financial value over time. The main components that make up a common chart are:
Price Axis
The vertical axis represents how much the asset is worth.
Time Axis
The horizontal axis symbolizes the time, often broken down into intervals Forex Education such as hours, minutes days, weeks, or days.
Candlesticks
Each candlestick is a particular period e.g. an entire day that shows the open and close prices, and the high, low, and closing prices for that time frame.
Indicators
Tools that may be placed on the chart for analysis of technical aspects give insight into price trends, momentum, and market volatility.
Common Types of TradingView Chart
TradingView has a range of different types of charts suitable for trading strategies:
Candlestick Chart
It is the most widely-used chart type that shows the price information using candles.
Line Chart
It is a simple chart that links the closing prices for each date with a straight line.
Bar Chart
It is similar to a line chart. However, every bar lists high, low close, and open rates of a particular timeframe.
Renko Chart
This chart focuses on price movements instead of the period frame. It is equal-sized boxes that show price fluctuations.
Kagi Chart
It highlights price reversals, connecting price movements using lines, but ignoring the duration.
How to Customize TradingView Charts
TradingView has many options to adapt your charting experience to your particular needs:
- You can set the chart for a particular interval of time like one minute, five minutes, or one hour.
- Access to multiple technical indicators can become very easy. They include RSI, moving average, MACD, etc. so that a deep analysis of market trends can be obtained.
- Use drawing tools to draw shapes, lines, or trend lines to find patterns, or draw a line around support and resistance areas.
- You can modify the chart theme. Pick one that matches your preferences in terms of visuals and improves the readability of your chart.
TradingView Chart Gives You the Power to Dive Deep into the Trade Market
TradingView chart is a powerful feature that helps to analyze the trade market. In acquainting yourself with the many types of charts and the customization options available in TradingView, you can design superior visualizations, and increase your decisions when trading.
Read More Post Click Below links :
No deposit bonus forex
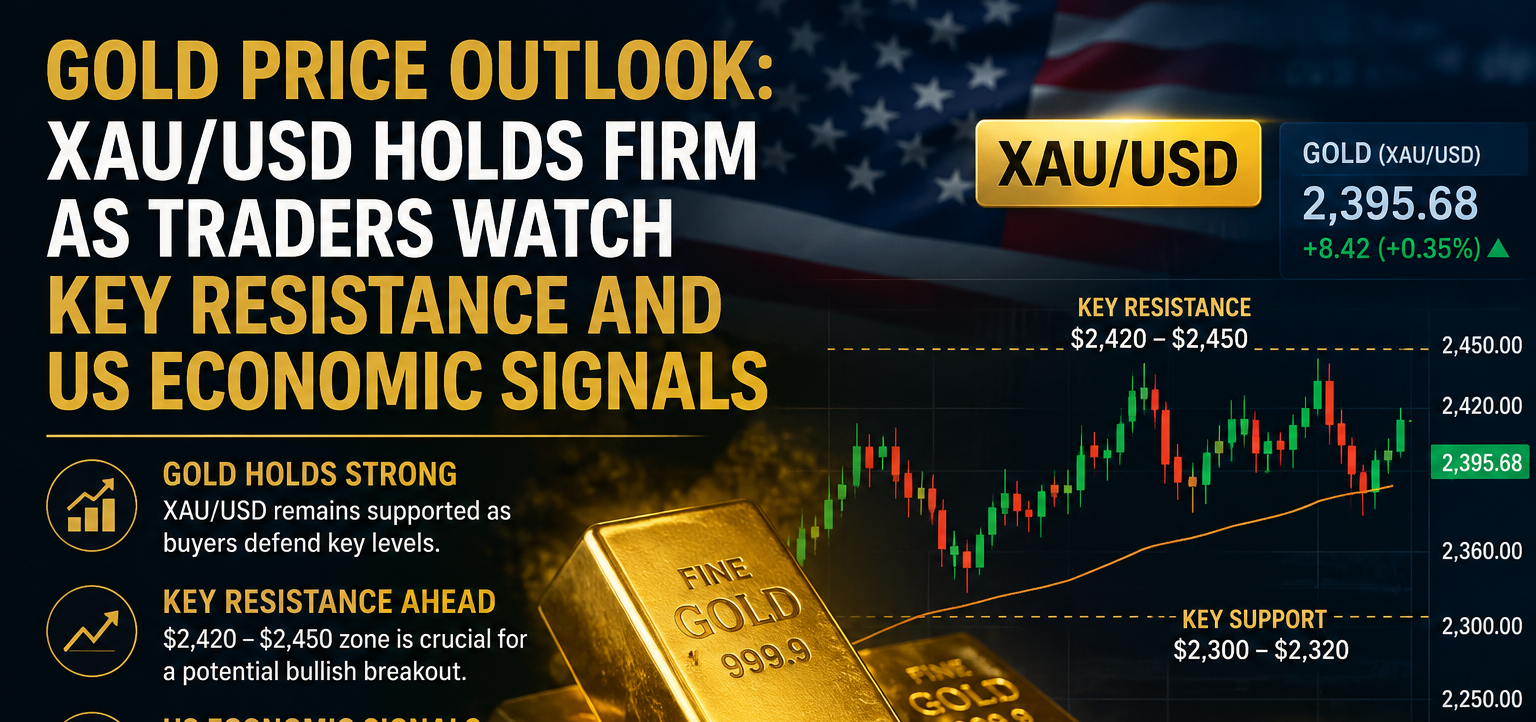
Xauusd forecast next week
Gold price forecast tomorrow