Last Updated on January 8, 2026 by Deon
Fibonacci indicators are used by traders as an effective map for reading market rhythm. Based on centuries-old sequences, traders utilise Fibonacci levels to detect support and resistance zones where prices might pause, reverse course or accelerate further. Here, you can view the important details about fibo indicator & its common uses.
How it Works without Math Headaches
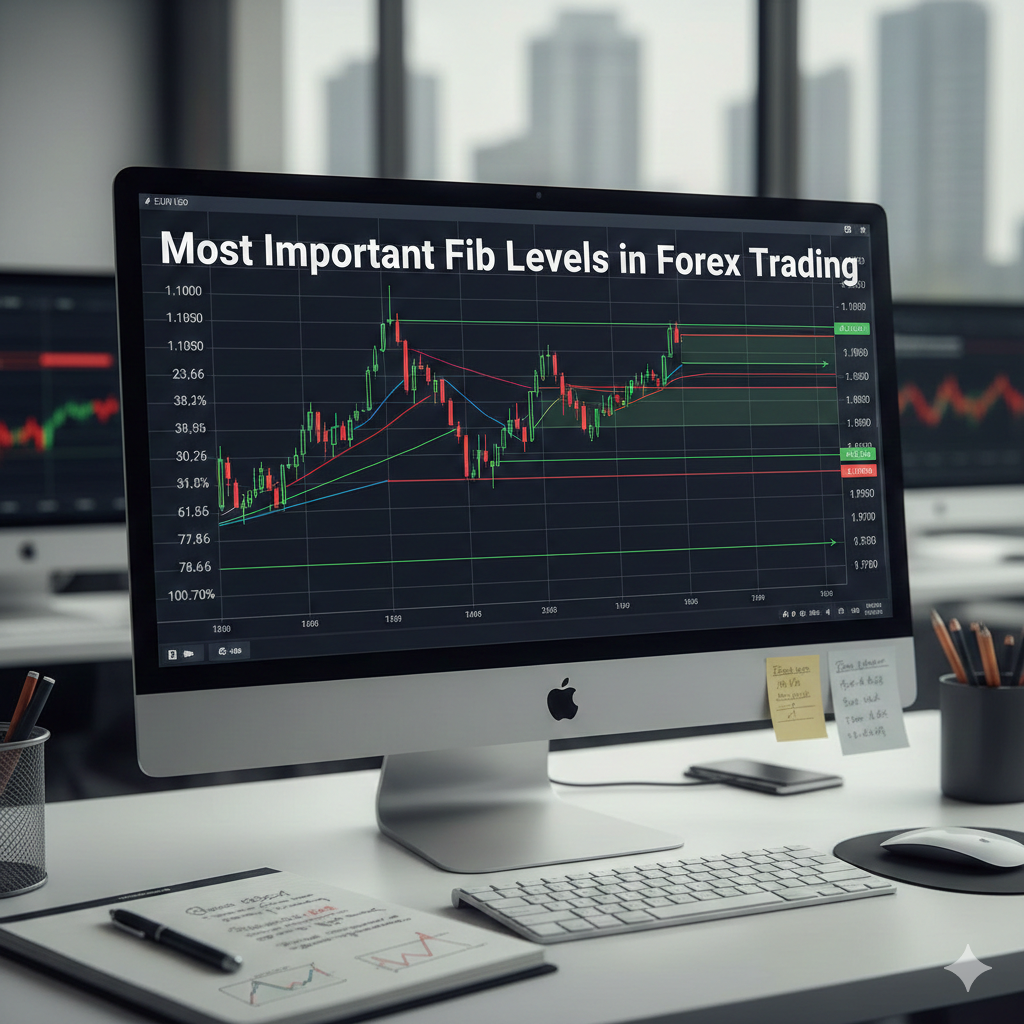
Traders select recent swing high and low points before using this indicator to draw horizontal lines at various ratios, 23.6%, 38.2%, 50%, 61.8% and 78.6% from Fibonacci family numbers that appear time after time in market behaviour. Think of these horizontal lines like tide marks on your chart. Price often reacts around them.
Common Strategies Employed By Traders
Locating Entry Points
When looking for entry points, traders often wait for pullbacks near Fibonacci levels before jumping back in with their main trend. This provides for a clean and more systematic entry than trying to chase any big moves that occur in a market.
Setting Stop Losses and Targets
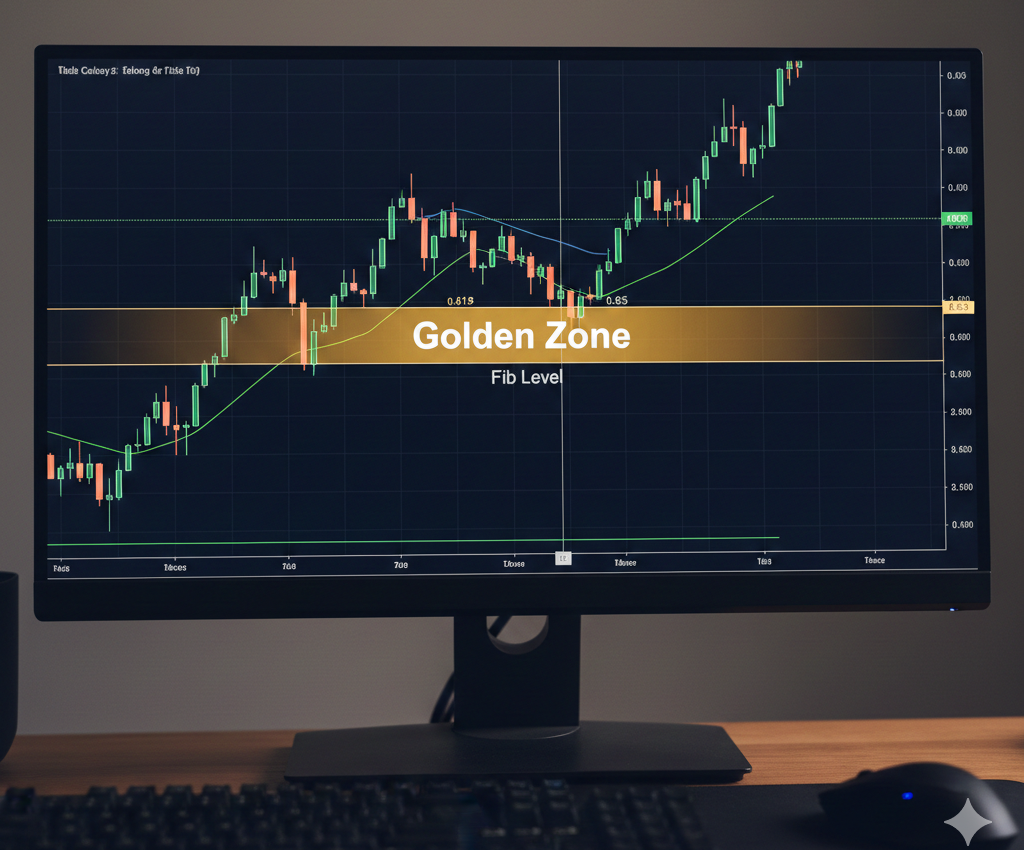
Fib levels provide an opportune point from which traders can establish stop losses or take partial profits, for instance, when the price hits its 61.8% level after rebounding off it. Many traders may lock in gains at the next Fib line by placing stop loss orders there.
Combo Strategies
Fib levels work best when combined with candlestick patterns, moving averages or trendlines to build confidence and increase overall trustworthiness in an investment decision. When multiple signals align in sync, trust is increased exponentially.
Strategic Multitimeframe Trading
You can draw Fibs on larger timeframes to find major zones and then switch over to smaller charts for precise entries and exits.
Fibo Indicator & Its Common Uses: Practical Advices
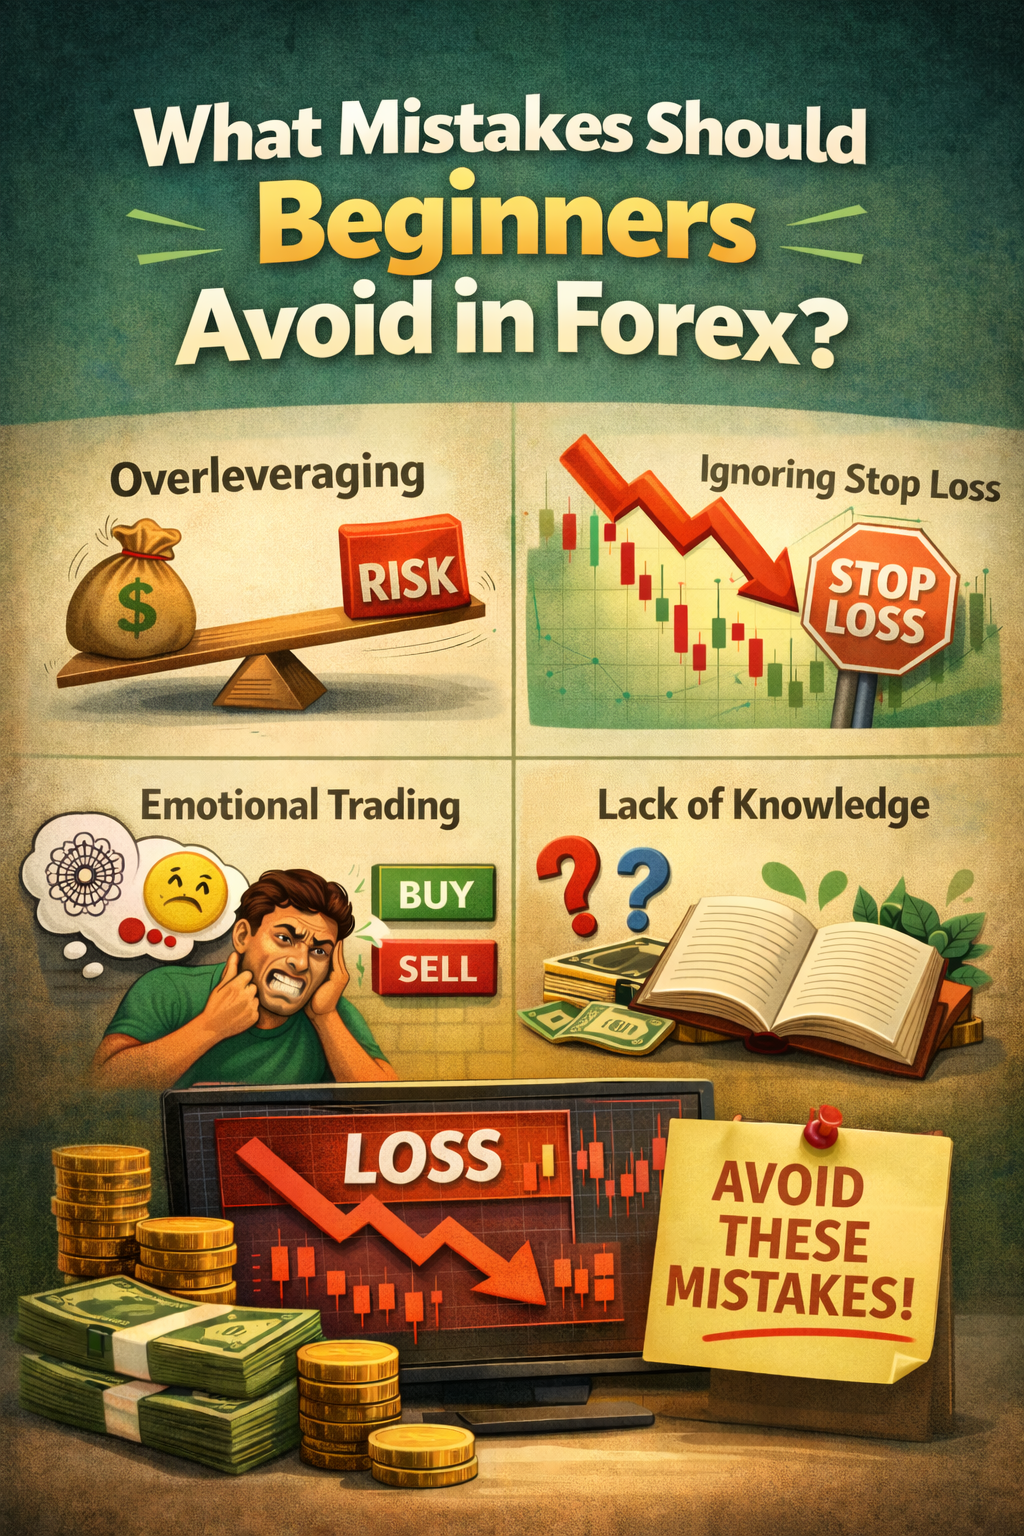
Do not treat Fibonacci like it is gospel. Markets can be unpredictable; these lines should only serve as guides, not guarantees. Use Fibonacci with proper risk management practices in mind, including visual adjustment if market structure suggests otherwise and without losing focus on why your level broke in the first place. Judge the market and keep going.
Understanding the Fibo Indicator & Its Common Uses Defines Your Trade Actions
Fibonacci is widely considered one of the key tools of geometric and psychological analysis, providing traders with a framework to organise trades, define risk exposure and remain patient during volatility-prone market periods. You can avail of the golden opportunities given by Neuron Markets to understand the important and useful indicators so that you can apply them in your trade business confidently and wisely. Not every level will hold, but when used appropriately, it becomes a reliable compass through which to view price action’s chaos.