Last Updated on June 18, 2026 by Deon
Introduction to Chart Patterns
Chart patterns are a part of technical analysis. They help traders understand price movements and guess what might happen in the market next. These patterns are made by how prices move on a chart and show what buyers and sellers are thinking.
If you trade forex, stocks, crypto or commodities learning chart patterns can really help you make decisions.
What are Chart Patterns?
Chart patterns are shapes that prices make on a trading chart. They help traders see if a trend will keep going, reverse or change direction. These patterns are based on how prices have moved in the past so they often happen again in markets.
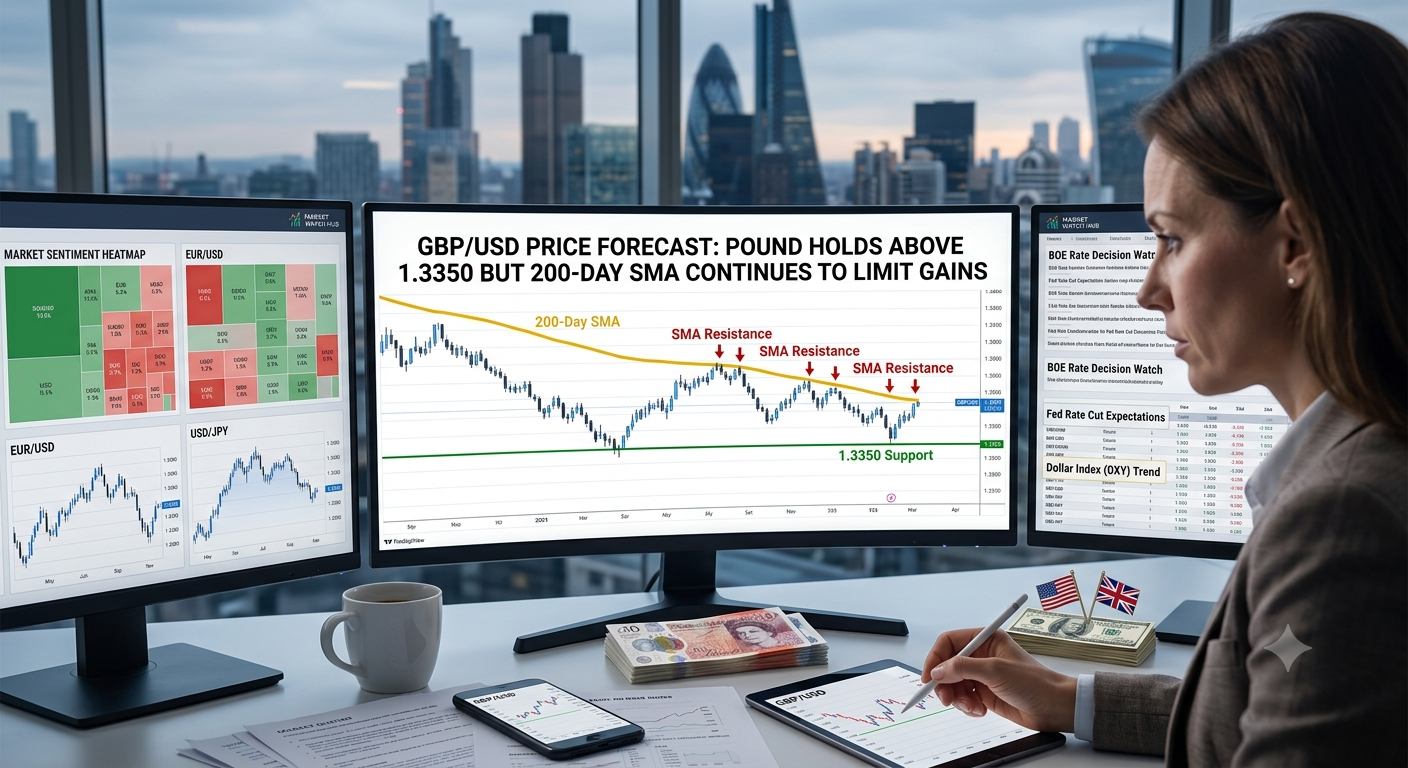
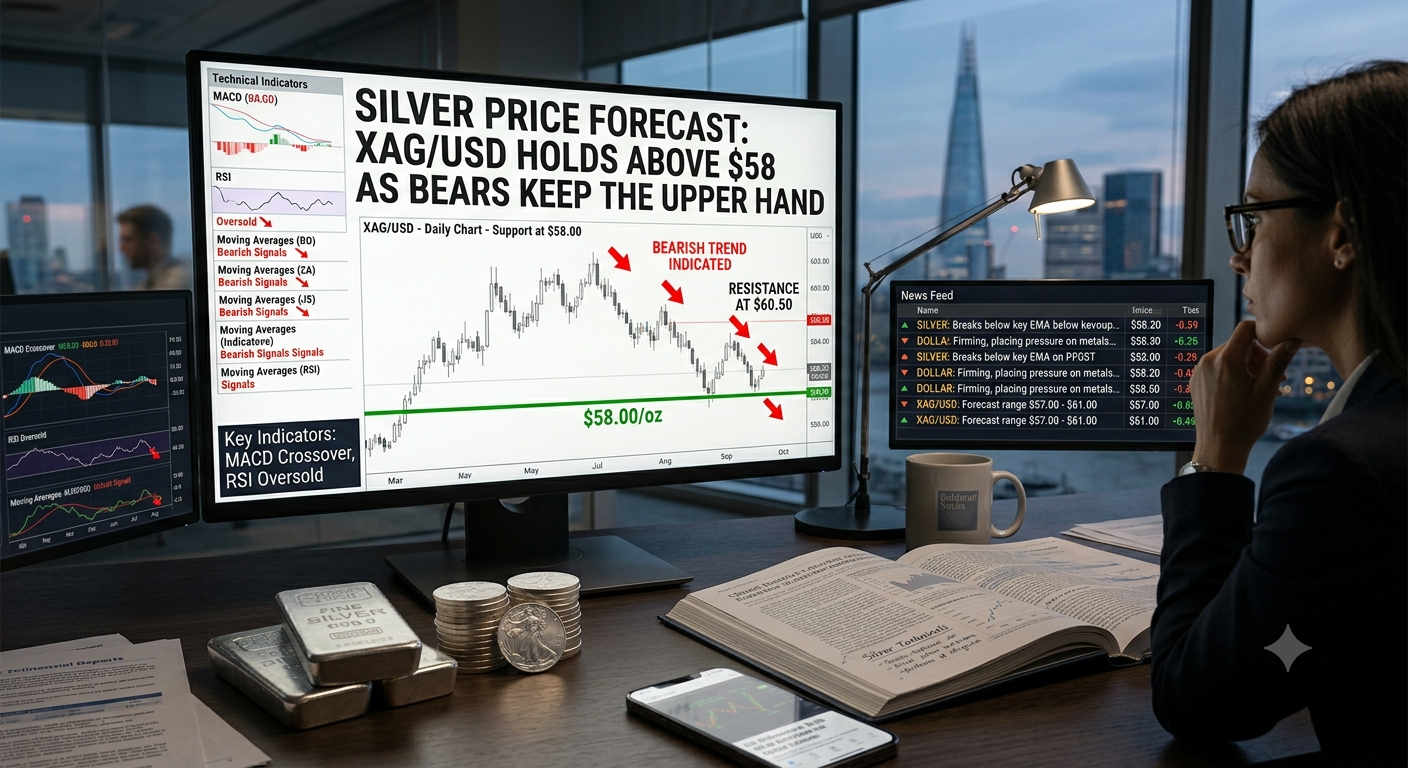
Traders use chart patterns along with things like RSI, MACD and moving averages to be more sure about what to do.
Types of Chart Patterns
There are two kinds of chart patterns:
1. Reversal Patterns
Reversal patterns mean that the current trend might change direction. These are super important for finding times to buy or sell.
Some common reversal patterns are:
Head and Shoulders
Inverse Head and Shoulders
Double Top
Double Bottom
For example a Double Top pattern often shows up after prices have been going up and means that prices might start going down.
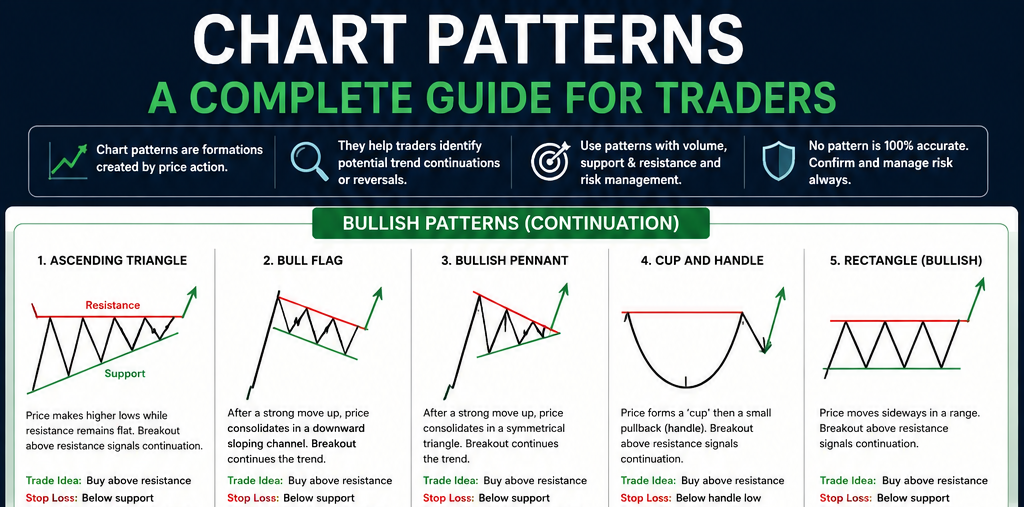
2. Continuation Patterns
Continuation patterns mean that the current trend will probably keep going after a pause.
Some common continuation patterns are:
Flags
Pennants
Triangles (like Ascending, Descending and Symmetrical)
For example a Bullish Flag happens during an uptrend. Means that prices might keep going up after a pause.
How to Identify Chart Patterns
Finding chart patterns takes practice and attention to detail. Here are some tips:
Always look at the trend first
Use timeframes to be sure
Wait for the pattern to be complete, before buying or selling
Check if volume changes (volume often goes up when theres a breakout)
Patience is key. Many beginners make the mistake of buying or selling before the pattern is fully formed.
Why Chart Patterns Are Important
Chart patterns are used a lot because they:
Help predict what the market will do
Make trading more accurate
Give times to buy or sell
Work in all financial markets
They are based on what buyers and sellersre thinking which makes them reliable if used correctly.
Final Thoughts
Chart patterns are a tool that every trader should learn. While no pattern guarantees success using them with risk management and other indicators can really improve trading performance.
It’s key to practice and look at charts often to get better at identifying chart patterns over time.