Last Updated on July 24, 2025 by Deon
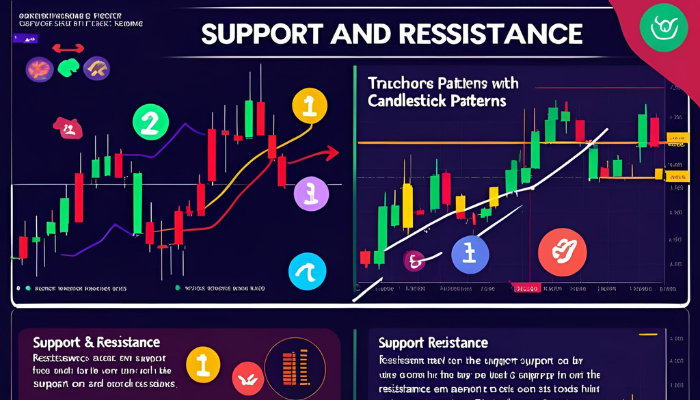
Few concepts in forex trading have as wide an appeal and universal respect as ‘support and resistance’. While indicators and strategies come and go, these foundational principles remain central to price analysis.
Not just chart markings or simple zones marked on charts, support and resistance act as important action points where market participants take steps towards price reversals or consolidations. ‘What is support /resistance’ makes you understand the risky and profitable situations in trade more accurately.
Support is Defined As
During market corrections, support is the price level where buying interest increases enough to slow or stop its decline, creating an ‘effective floor’. Prices don’t tend to drop through that floor before rebounding.
When an asset like EUR/USD keeps increasing from one price point, say 1.0800, this indicates buyers find this area to be appealing. It contributes towards stabilizing its price, at least temporarily. Traders tend to buy near support in expectation of an upward rebound. If this support fails to hold, even then it could indicate an intensifying bearish trend ahead.
Resistance is Defined As
Representing a deadlock that prevents further advances, resistance is defined as any price level where up trending is typically stopped due to increased selling pressure. It provides an obstacle that limits further gains.
When EUR / USD is unable to move beyond 1.0950, the level becomes what we call resistance and can either be used to cash in by the sellers or even open short contracts to drive the prices further down. Often, traders use this strategy of selling near resistance to hope that the market will reverse or consolidate, and then at some other time attempt a breakout.
Why Support and Resistance Matter
Along with knowing ‘what is support /resistance’, utilizing these levels to get the best results is also important. Support and resistance levels provide more than directional clues. They are integral parts of creating a successful trading plan. Here is why their significance should not be undervalued:
Strategic Entry and Exit Zones
These levels help you plan trades with clearly identified entry points; for instance, buying near support and selling near resistance, along with reasonable exit targets.
Effective Risk Management
Traders could restrict losses and save profits with sharp precision by defining Stop Loss and Take Profit orders only a bit above these points.
Trend Clarity
A pattern of repeated tests against support or resistance without breaking can provide insight into strength or weakness in an ongoing trend. However, breakouts could indicate momentum changes or trend reversals.
Market Psychology
These levels reflect traders’ collective memory and behavior. Past highs and lows often draw traders’ interest because they represent key junctures of value in trading history.
How to Determine Support and Resistance Levels Carefully
There are various effective approaches available to pinpoint these critical levels:
Past Highs and Lows
The swing highs and lows experienced in the past can be viewed as future resistance and support, respectively.
Tumble Lines
When connected, ascending lows or descending highs provide visual information of dynamic support/resistance levels.
Moving Averages
Moving Averages can provide support when prices exceed them, while Resistance Zones correspond with Fibonacci levels during pullbacks for an easy way of finding support or resistance areas during retracements.
Psychological Price Points
Simple and emotionally attractive round numbers like 1.1000 or 1.2000 usually receive some amount of interest and serve as natural aspects of support/resistance.
Support-Resistance Bias
One of the key dynamics to understand in market fluctuations is the ‘support-resistance flip’. Once the levels of support are conclusively broken, they have the tendency to become resistance zones and vice versa. This turnaround indicates a significant change in the market mood that offers mind-blowing trading opportunities.
To take an example, should EUR/USD break below the 1.0800 support level, then subsequently rise back and fail to achieve new highs, so 1.0800 can now be trading as a resistance point.
Learning about ‘What is Support /Resistance’ can Radically Enhance Accuracy & Confidence in Trading
By learning completely about the identification and application of support and resistance levels, you will sharpen your entries, tighten risk control measures, and gain a distinct edge in trading forex market. Neuron Markets is the genuine platform that doesn’t make any compromise on your success and, for that, equips you honestly with all the tools and strategies, including support and resistance levels utilization.
No matter if it be breakouts, reversals, or trend continuations you trade, support/resistance levels serve as your parameter in confidently navigating price action with each trade.