Within the dynamic realm of forex trading, traders seek reliable tools to assist with decision-making. One such tool is the Moving Average Convergence Divergence (MACD) indicator – widely utilized by traders for providing insight into market trends and potential trading opportunities. Here we explore its fundamentals as well as answer three frequently asked questions about it to provide greater understanding in regards to its significance within forex.
1. What is the MACD Indicator, and How Does It Work??
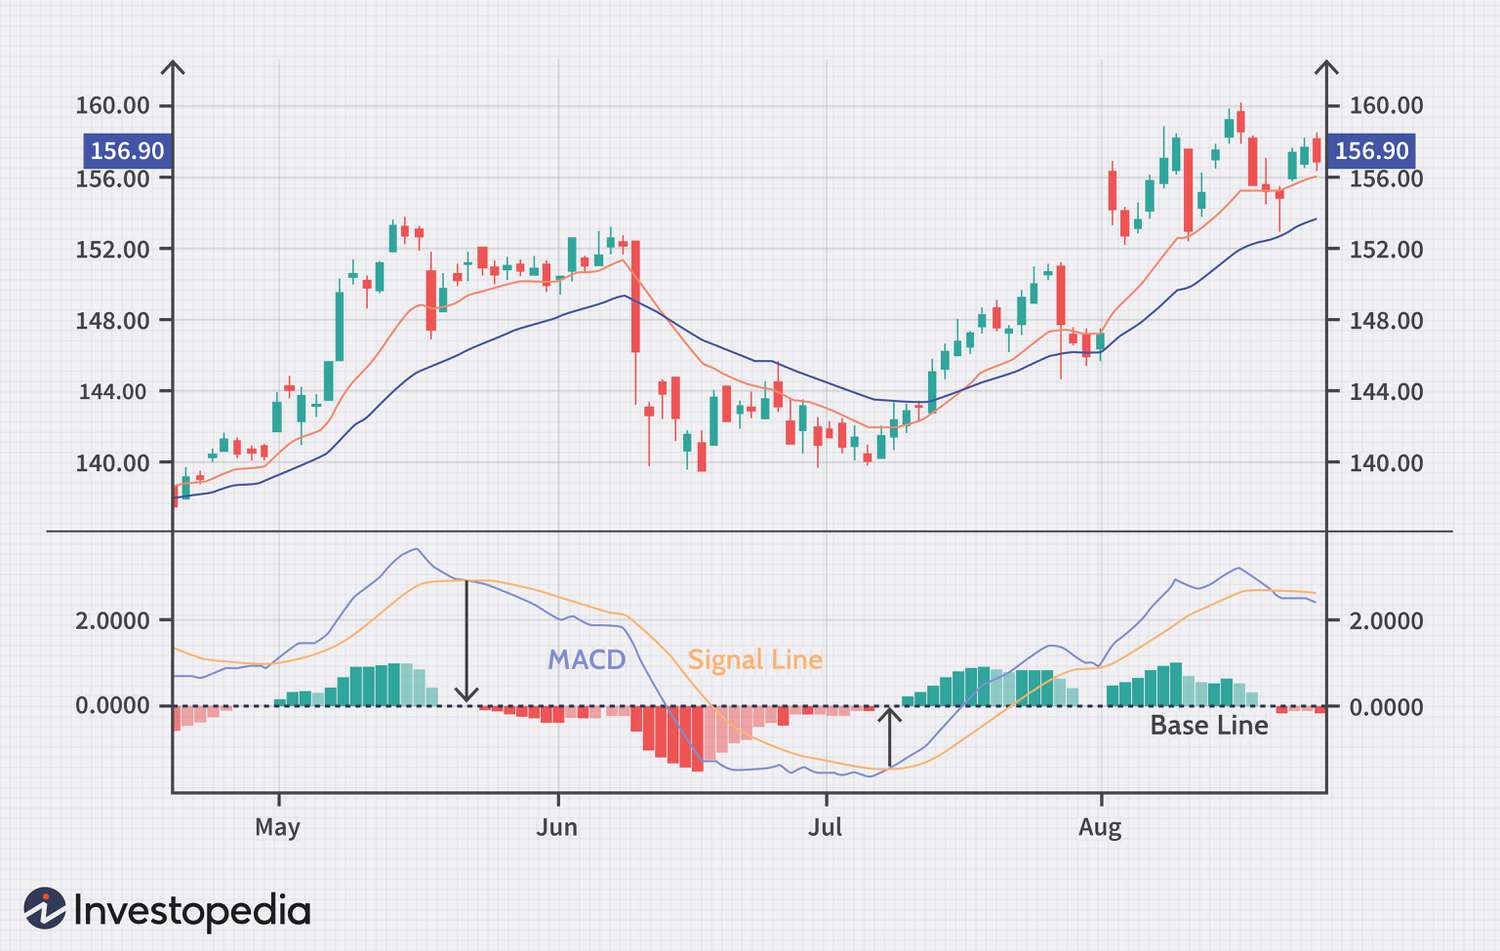
The MACD indicator is a useful technical analysis tool used to detect potential trend reversals, measure momentum and generate buy or sell signals. This indicator comprises two lines derived from exponential moving averages (EMAs). These two lines, known as MACD and signal lines respectively, reflect different aspects of market movement; MACD stands for the difference between shorter-term EMAs and longer-term ones while signal line acts as an EMA of MACD itself. Convergence and divergence of MACD lines signals potential market shifts; when one crosses above another it produces a bullish signal which suggests buying opportunities; conversely when crossing below, bearish signals appear which suggest selling opportunities.
2. How Can the MACD Indicator Be Used in Forex Trading?
a)Recognizing Trend Reversals:The MACD indicator helps traders detect potential trend reversals by monitoring crossovers between its MACD line and signal line. A bullish crossover, whereby MACD crosses above signal, indicates a shift from downtrend to uptrend and suggests potential buy signal; similarly, bearish crossovers signal potential reversal from an uptrend back into downward movement indicating potential sell signals.
b)Gauging Momentum: By looking at the distance between the MACD line and signal line, traders can assess price momentum. A wider gap indicates strong momentum that suggests that an existing trend may persist while narrower gaps may signal weakening momentum, suggesting potential trend reversal or consolidation.
c)Divergence Analysis:The MACD indicator can be used to detect divergences between price and its lines. A bullish divergence occurs when the price makes lower lows while MACD forms higher lows; conversely, bearish divergences emerge when the price makes higher highs while MACD drops low highs; this could signal an impending bearish reversal.
3. Are There Any Restrictions When Utilizing the MACD Indicator?
Although the MACD indicator can be an extremely powerful tool, it’s important to be mindful of its limits when making trading decisions and also consider other aspects. For instance:
a)Lag Time: Like many trend-following indicators, the MACD lags behind price movements. For optimal use of this indicator and to minimize false signals, traders may wish to combine it with additional tools or combine with other indicators in order to verify signals and reduce false positives.
b)False Signals: During periods of low volatility or range-bound markets, the MACD indicator may generate false signals. Therefore, traders should exercise extreme caution and consider market conditions prior to placing trades solely based on MACD signals.
c)Overbought and Oversold Conditions: As the MACD indicator does not have specific overbought and oversold levels, traders should utilize additional indicators, such as oscillators such as Relative Strength Index (RSI), to accurately gauge potential overbought or oversold market conditions.
My final remarks about the MACD indicator are that it is an invaluable technical analysis tool widely employed in forex trading. By observing crossovers, momentum gauges, and divergences to gain insights into potential trend reversals or generate buy or sell signals. Unfortunately, though, using this approach to analysis is far from foolproof – watch out for potential trend reversals which might cause sudden drops or spikes! We will train you for that.