Last Updated on August 20, 2026 by Deon
The price of something does not always go up or down in a line. Sometimes the market goes through a low point, and then it changes direction quickly. This is called a liquidity sweep. Learning about liquidity sweeps can help people who trade understand why they should pay attention to high and low points. Of buying or selling right away they can wait and see if the price stays at the new level or goes back down.
A Simple Liquidity Sweep Example
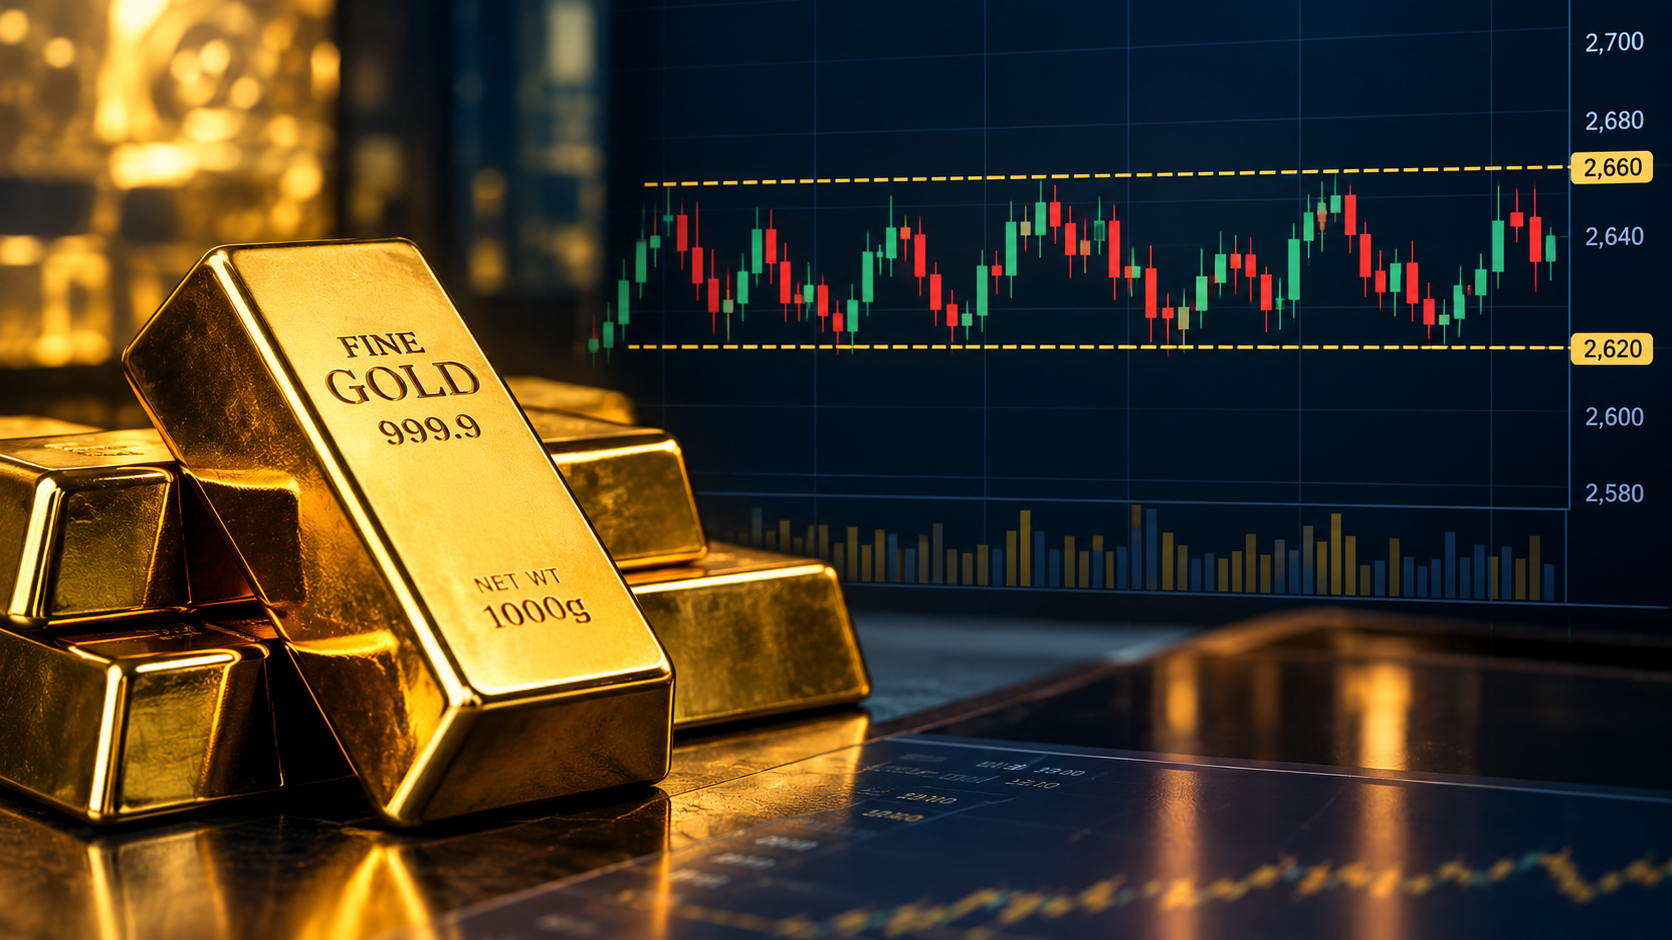
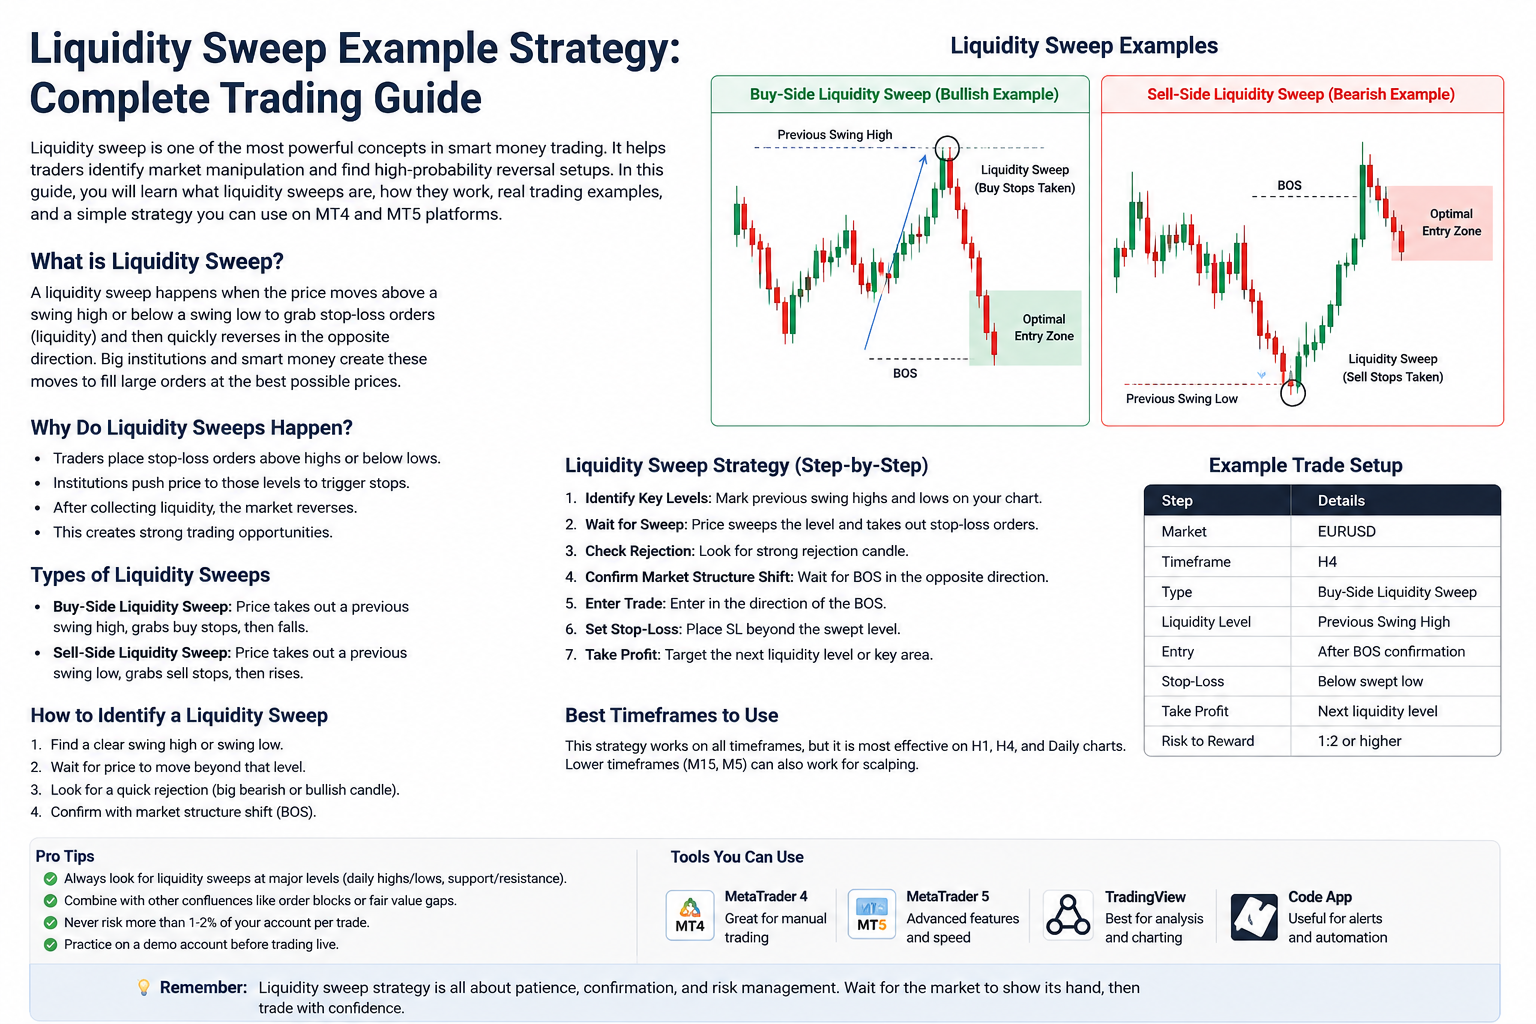
Let us say the market is moving up and down inside a range. The price has gone up to a high point several times making it easy to see on the chart. Then the price goes above that point. A trader might think it is a time to buy, but the price does not stay up and goes back down into the range.
This is what happens: the price goes up to the high point several times then it goes above that point but it does not stay there and goes back down. This is an example of a liquidity sweep.
The important thing to remember is that the sweep is not always a signal to buy or sell. The trader might wait to see if the price is really changing direction.
Sell-Side Liquidity Example
The same thing can happen when the market is going down. Let us say the USD/JPY currency pair has gone down to the low point several times. Then it goes below that point. It does not stay there and goes back up. This can be a sign of a sell-side liquidity sweep.
A trader might wait to see what happens next before deciding what to do.
Buy-Side Liquidity Example
Now let us say the market has gone up to the high point several times. Then it goes above that point. It does not stay there and goes back down. This can be a sign of a buy-side liquidity sweep.
Here is what can happen in situations:
Buy-side sweep: the price goes above a high point but then it goes back down
Sell-side sweep: the price goes below a low point but then it goes back up
Failed breakout: the price goes above a point but then it goes back down into the range
Breakdown: the price goes below a low point but then it goes back up
Why Liquidity Areas Matter
There are many people trading in the market and they all have different strategies. Some people put stop-loss orders above or below high and low points while others use those points to decide when to buy or sell.
Because of this obvious high and low points can become areas to watch. This does not mean that big traders always try to trick traders, but it does mean that visible price levels can be important.
How to Confirm a Sweep
To confirm a liquidity sweep you can do the following:
1. Wait to see if the price is really changing direction.
2. Look at the market structure to see what is happening.
3. Check the picture to see if the sweep makes sense.
4. Look at the momentum to see if the price is really moving.
5. Decide how risk you are willing to take before you make a trade.
Liquidity. Break of Structure
These two things are often used together. For example the price might sweep a low point and then break a nearby high point. The sweep shows that the price is changing direction and the break of structure confirms it.
The same thing can happen in reverse: a buy-side sweep can be followed by a break of structure or a sell-side sweep can be followed by a bullish break of structure.
Timeframes and Liquidity Sweeps
A liquidity sweep can happen on any timeframe. It might be more important on some timeframes than others. A small sweep on a one-minute chart might not be as important as a sweep on a weekly chart.
Traders should look at timeframes to get a better understanding of what is happening.
MT4 and MT5 Chart Analysis
You can use MT4 and MT5 to look at liquidity sweep setups. You can draw lines around high and low points and switch between timeframes to compare short-term and long-term structure.
Keeping the chart simple can make it easier to see what is happening.
Risk Management
No strategy can guarantee a trade. The price might sweep a level. Then keep going in the same direction.
To avoid losing money, traders should consider the following:
How much to buy or sell
Where to put stop-loss orders
How risk to take
How often to trade
How volatile the market is
What is happening in the news
A strategy with poor risk management can still result in losses.
Final Thoughts
A liquidity sweep strategy is mainly about watching how the price behaves around high and low points. The important thing to learn is not just to trade every sweep but to understand how liquidity, market structure, momentum and confirmation work together.
Traders can practice by marking high and low points on MT4 or MT5 and studying what happened next. Over time this can help them become traders and make more disciplined decisions.