Last Updated on October 15, 2026 by Deon
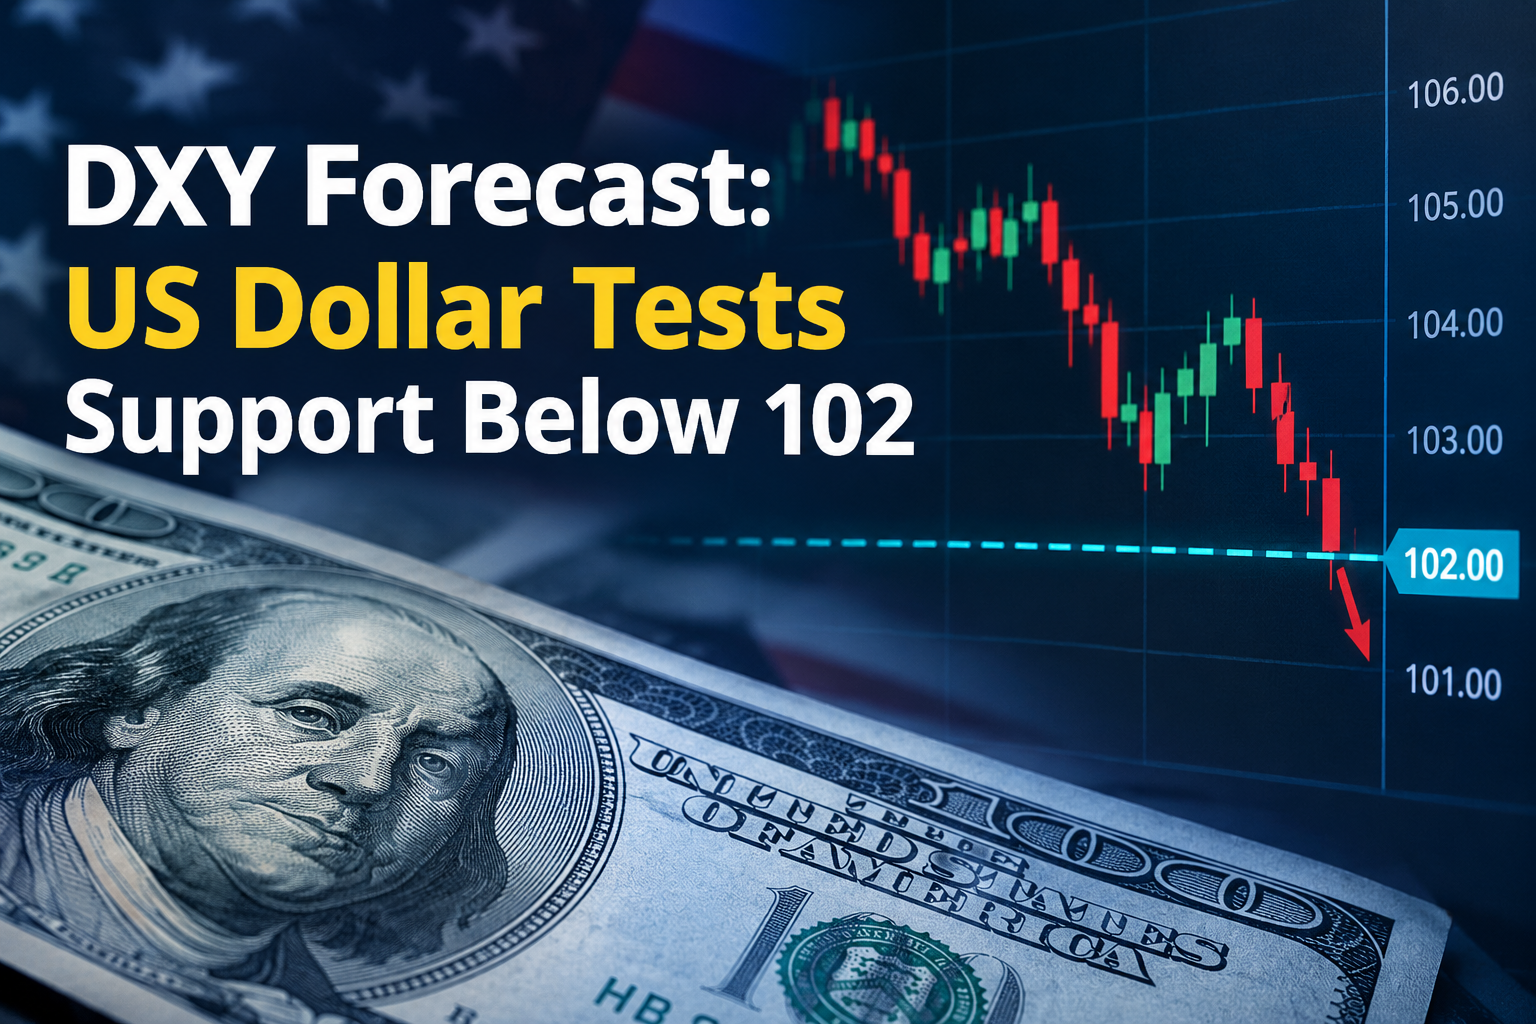
The US Dollar Index (DXY) faced selling pressure on Thursday extending the drop seen the day before. The index fell below 102.00 after reaching about 103.00 in the week the highest level since April 2025.
The drop shows a shift in market stance after the US inflation data. Although Septembers Consumer Price Index (CPI) was higher than expected traders now think the Federal Reserve might keep interest rates the same at its October meeting.
Lower Treasury yields and profit‑taking together have made the US Dollar less attractive in the term.
Treasury Yields Weigh on DXY
A reason for the US Dollars decline is the sharp drop in US Treasury yields. Lower yields make holding US Dollar‑denominated assets less appealing especially when people expect the Federal Reserve to tighten quickly.
Reports that China might buy US Treasury bonds through a channel have drawn market attention. These buying expectations have helped lower Treasury yields and added pressure on the US Dollar.
As yields fell traders took profits on positions that had gained from the strong move after the CPI.
This explains why the US Dollar Index (DXY) has had trouble keeping the gains from earlier in the week.
Fed Rate Expectations Remain Important
after the latest drop the Federal Reserve is still an important supporter of the US Dollar.
Markets still expect a chance of another interest‑rate rise before the end of 2026 with expectations above 85% per the FXStreet report. Oil‑driven inflation risks may keep policymakers careful about loosening conditions too fast. This gives the US Dollar an outlook.
On one side falling Treasury yields and the expectation of rates in October are pulling down the US Dollar Index (DXY). On the side ongoing inflation risks may push the Federal Reserve to keep a tight policy limiting how far the US Dollar can fall.
Geopolitical Risks Could Support the Dollar
Geopolitical events are another factor that traders are watching.
Ongoing tensions in the Middle East and uncertainty about the situation could raise demand for safe‑haven assets. The US Dollar usually gains when markets are uncertain because investors look for liquidity and safety.
If geopolitical risks grow stronger demand for the US Dollar could rise even if technical signs show short‑term momentum.
This means traders should not assume that the recent decline in the US Dollar Index (DXY) will automatically turn into a long‑term downtrend.
DXY Technical Outlook
The technical view is becoming more cautious for those who bet on the US Dollar.
The US Dollar Index (DXY) is trading above the 23.6% Fibonacci retracement level near 101.92. That level is the key support zone in the latest analysis.
The index also stays above the 100‑period Simple Moving Average on the four‑hour chart. That keeps the short‑term technical bias slightly bullish even after the recent drop.
However momentum signals are weaker.
The Relative Strength Index (RSI) is 44 showing that selling pressure has gone up but has not gone far below normal. At the time the Moving Average Convergence Divergence (MACD) is turning lower in negative territory.
Together these signals imply that the US Dollar Index (DXY) may stay under pressure in the future.
Key Support Levels to Watch
The 101.92 area is the first main level traders should watch. If the US Dollar Index (DXY) stays below this Fibonacci support the chance of losses could grow.
The next technical level is around the 100‑period Simple Moving Average near 101.79.
If sellers push the US Dollar Index (DXY) below that level traders may look at a Fibonacci support cluster between about 101.28 and 100.77.
A move into that area would mean a pullback from the recent high near 102.95.
For traders these levels can show whether the current drop is a normal pullback or turns into a bigger downtrend.
Resistance Remains Near 102.95
On the upside the recent cycle high near 102.95 is the resistance level.
A clear move above 102.95 could show that buyers have taken control and may open the door to gains.
Until that occurs the US Dollar stays vulnerable to profit‑taking especially if Treasury yields keep falling.
Traders should watch how the US Dollar reacts near 101.92 on the downside and near 102.95 on the upside.
US Dollar Outlook
The near‑term outlook, for the US Dollar Index (DXY) is balanced but becoming more cautious.
The sharp recovery earlier in the week showed that Dollar buyers remain active especially when inflation and Fed policy expectations support US rates. However the latest reversal shows that gains can quickly disappear when Treasury yields fall.
Upcoming US economic releases, including Producer Price Index data and retail sales could give clues about the economy and about the Federal Reserves next moves.
Stronger-than-expected data could lift yields. Support the Dollar Index while weaker figures could reinforce expectations for a less aggressive Fed and put more pressure on the Dollar.
The US Dollar Index is testing support below 102 after extending its retreat from the recent 103.00 area. Falling Treasury yields, profit‑taking and expectations that the Fed may hold rates steady in October have weighed on the Dollar Index.
Technically 101.92 is the major support, followed by 101.79 and the 101.28‑100.77 region. On the upside 102.95 remains the resistance.
For now traders are likely to focus on the reaction, around these levels while monitoring US data Treasury yields, Fed expectations and geopolitical developments.