Last Updated on September 2, 2026 by Deon
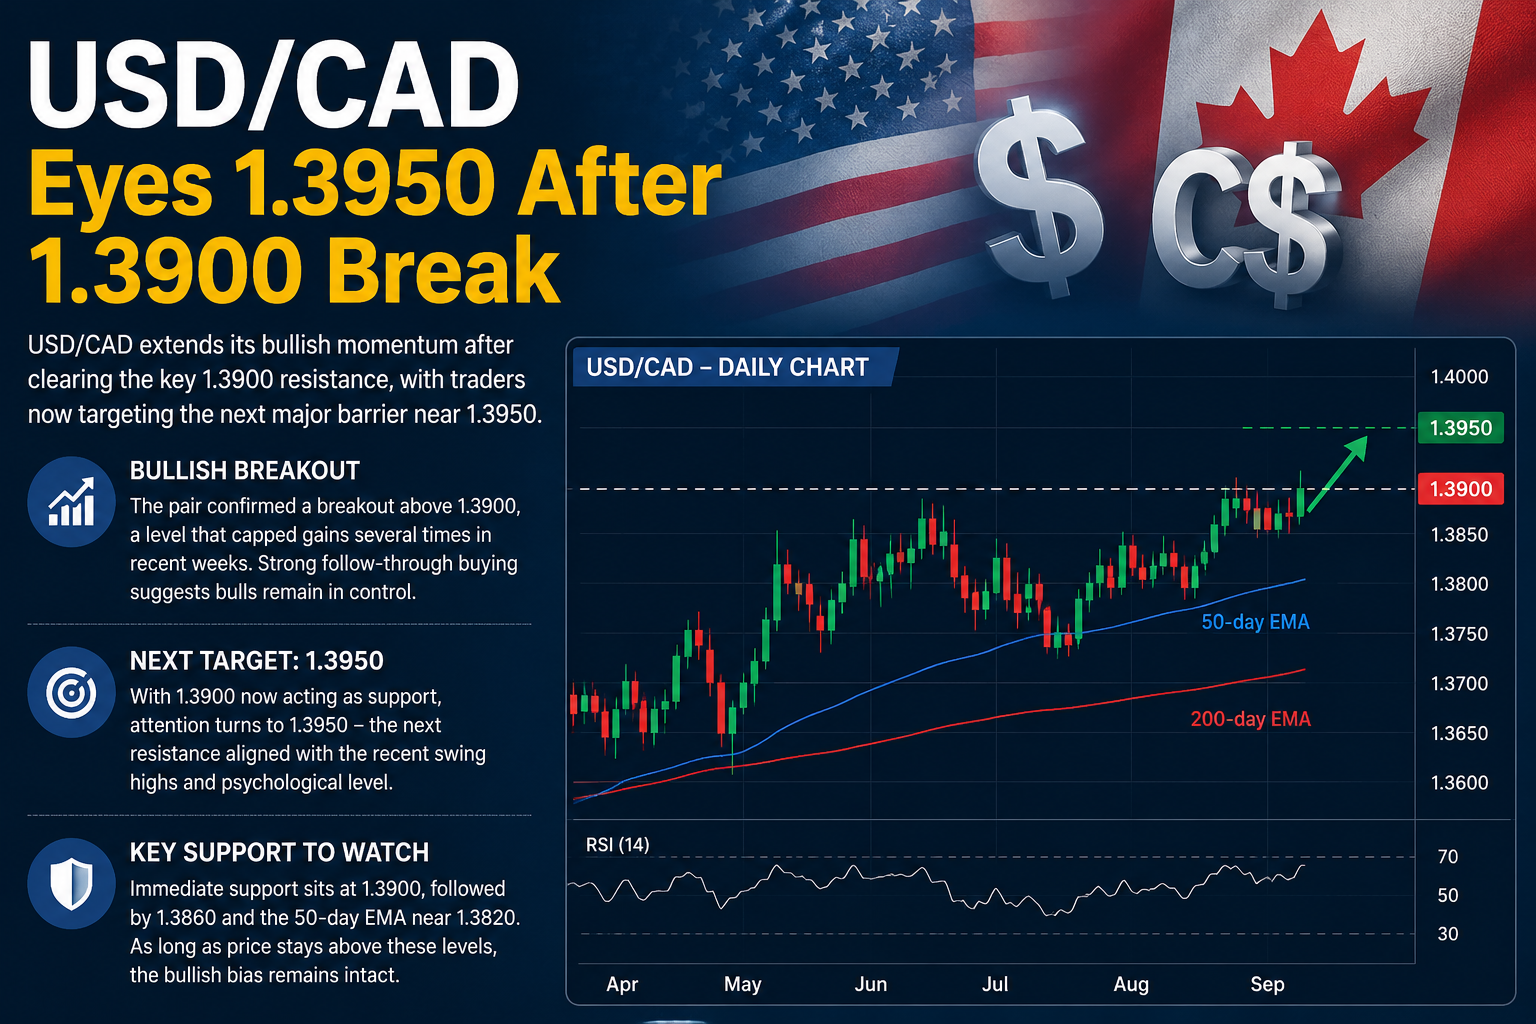
The USD/CAD pair is showing strength as the US Dollar is gaining against the Canadian Dollar. After going above a technical point near the 1.3900 level the pair has gone up and is now getting close to an important barrier around the 50-day Exponential Moving Average (EMA).
Recent price movement suggests that the outlook for USD/CAD is getting better. Traders might still need more proof before expecting a stronger move to the upside. The pair is staying above its short-term moving average and momentum indicators show a market that is not clearly leaning one way or the other.
With USD/CAD near 1.3940 during the time the big question is whether buyers can push the pair above the 50-day EMA near 1.3949. If they do that could support the outlook and create a path for higher prices.
USD/CAD Breaks Above the 1.3900 Point
Breaking above 1.3900 is an event for the price forecast of USD/CAD. This area was a technical point meaning a lot of market factors were happening around the same price.
Going over that point shows that buying has increased. The pair has also gone above the edge of a downward channel on the daily chart, which may mean a possible positive change after a previous period of weakness.
The market is not showing very strong positive momentum yet. USD/CAD is still between technical points, which means the next move could decide the short-term direction.
For traders the 1.3900 area may now be a level to watch. If USD/CAD stays above that area buyers could keep control. If it drops below that could weaken the setup and increase the chance of another drop.
50-Day EMA Becomes Major Barrier
The main focus for traders of USD/CAD is the 50-day EMA, which’s near 1.3949. This moving average is a medium-term technical barrier.
A move that stays above the 50-day EMA could give proof that the recent recovery has more room to go. This kind of move would improve market mood. Could bring in more buyers.
According to the view a successful move above this barrier may allow USD/CAD to go higher including the area of the nearly 17-month high around 1.4248 from June 2026.
That does not mean the pair will go to that point. Forex markets often have drops waiting periods and false moves. Traders will probably watch if the daily price stays above the 50-day EMA before being more sure about a positive trend.
RSI Shows Balanced Momentum
The 14-day Relative Strength Index or RSI, is around 51. This number suggests that the market momentum is balanced.
Usually an RSI above 70 means the market is too high and a number below 30 means it is too low. With the indicator near the middle of 50 USD/CAD is not showing momentum in either direction.
This balanced RSI number is important because it shows the market still has room to go either way. A stronger move above the 50-day EMA with a rising RSI could support the positive case.
But if the price has trouble near the barrier and the RSI starts to go down the pair could face selling.
Now the technical view is cautiously positive instead of very strong.
1.3882 is Still a Key Support
On the downside the nine-day EMA near 1.3882 is the support level to watch.
USD/CAD is still above this short-term moving average, which helps the recovery. Long as the pair stays above this level buyers may keep the upper hand.
If the price drops below the nine-day EMA that could mean the positive momentum is fading. This could bring the pair back toward the channel and possibly start the previous negative trend again.
If selling gets stronger USD/CAD could go toward the side of the channel near 1.3670. A move below that level could take the pair to the lower target around 1.3481, which was last seen in October 2024.
Key USD/CAD Levels to Watch
Technical Level Price Area Market Importance
Immediate Resistance 1.3949 50-day EMA
Current Trading Zone Around 1.3940 Near-term Price Action
Key Breakout Area 1.3900 technical confluence
Immediate Support 1.3882 Nine-day EMA
Lower Support Around 1.3670 Descending channel boundary
Major Downside Level 1.3481 Long-term support zone
Major Upside Target 1.4248 Nearly 17-month high
Fed Outlook Still Supports the US Dollar
The fundamental factors may also be important for the USD/CAD pair. Recent focus has been on the outlook for US interest rates and comments from Federal Reserve officials.
A strict monetary policy outlook can support the US Dollar because higher interest rates may make US assets more appealing. Recent comments suggested concerns that inflation could stay too high keeping the possibility of tightening in mind.
For USD/CAD this means upcoming US economic data and Federal Reserve expectations could continue to affect the movement of prices.
At the time changes affecting the Canadian economy Bank of Canada policy expectations and oil prices can also be important. Since Canada is an oil producer changes in oil prices can sometimes affect the demand for the Canadian Dollar.
USD/CAD Price Forecast: What Comes Next?
The technical view for USD/CAD has improved after the pair went above the 1.3900 area. The break from the channel also suggests that the previous negative pattern may be losing strength.
The 50-day EMA near 1.3949 is still the main obstacle for buyers.
A clear and lasting move above this level could strengthen the view and possibly create chances to go higher. If it does not break above the 50-day EMA it could lead to waiting or a move back toward the nine-day EMA near 1.3882.
For now traders of USD/CAD should watch the 1.3949 resistance and the 1.3882 support levels. A move above either could give a sign of the pairs next move.
Final Thoughts
The USD/CAD pair is trying to build positive movement after breaking above the important 1.3900 point. The next major challenge is near the 50-day EMA around 1.3949.
Technical indicators now show a market that’s balanced meaning traders should stay careful and wait for more proof. A successful move above the barrier could strengthen the outlook for USD/CAD while a fall below short-term support could bring in more negative pressure.
As always traders should use analysis with economic data, central bank changes and good risk management before making trading decisions. Forex markets can move fast especially when big economic data or changes, in interest rate expectations affect the US Dollar or the Canadian Dollar.